Result interpretation - H3K4me3 modification in mouse brain
Understanding the epigenomic landscape in the tissue of origin is crucial for deciphering the spatial regulation of gene expression. In this tutorial, we will showcase the application of STellaris in the analysis of single-cell multiomics data. STellaris transfers the spatial locations generated from the spatial mapping results to the corresponding cells in other omics data for spatial construction.
Here, we use single-cell multiomics data from the mouse frontal cortex and hippocampus generated by Paired-Tag technology (GSE152020), which consists of both transcriptomic and H3K4me3 epigenomic data that were jointly profiled in single cells. Notably, in addition to the regular scRNA-seq data, we also uploaded the epigenomic profiling of H3K4me3 modification, a fragment file containing read counts detected in genomic regions. To compare the spatial signature of H3K4me3 modification generated using STellaris with that profiled by epigenomic MERFISH, a recently reported method that enables spatially resolved single-cell epigenomic profiling in complex tissues (https://doi.org/10.1016/j.cell.2022.09.035), we also upload a peak file containing genomic positions of active promoters of 127 genes that were inspected in the epigenomic MERFISH paper. Note that the H3K4me3 signals in 127 active promoters will be aggregated from the H3K4me3 fragment file and ultimately reported in the result page. The result page of this case study (H3K4me3 modification in mouse brain) is available at 75afdf70-c300-11ed-8a89-3fb9e5c5307c . You can also access it from the home page.

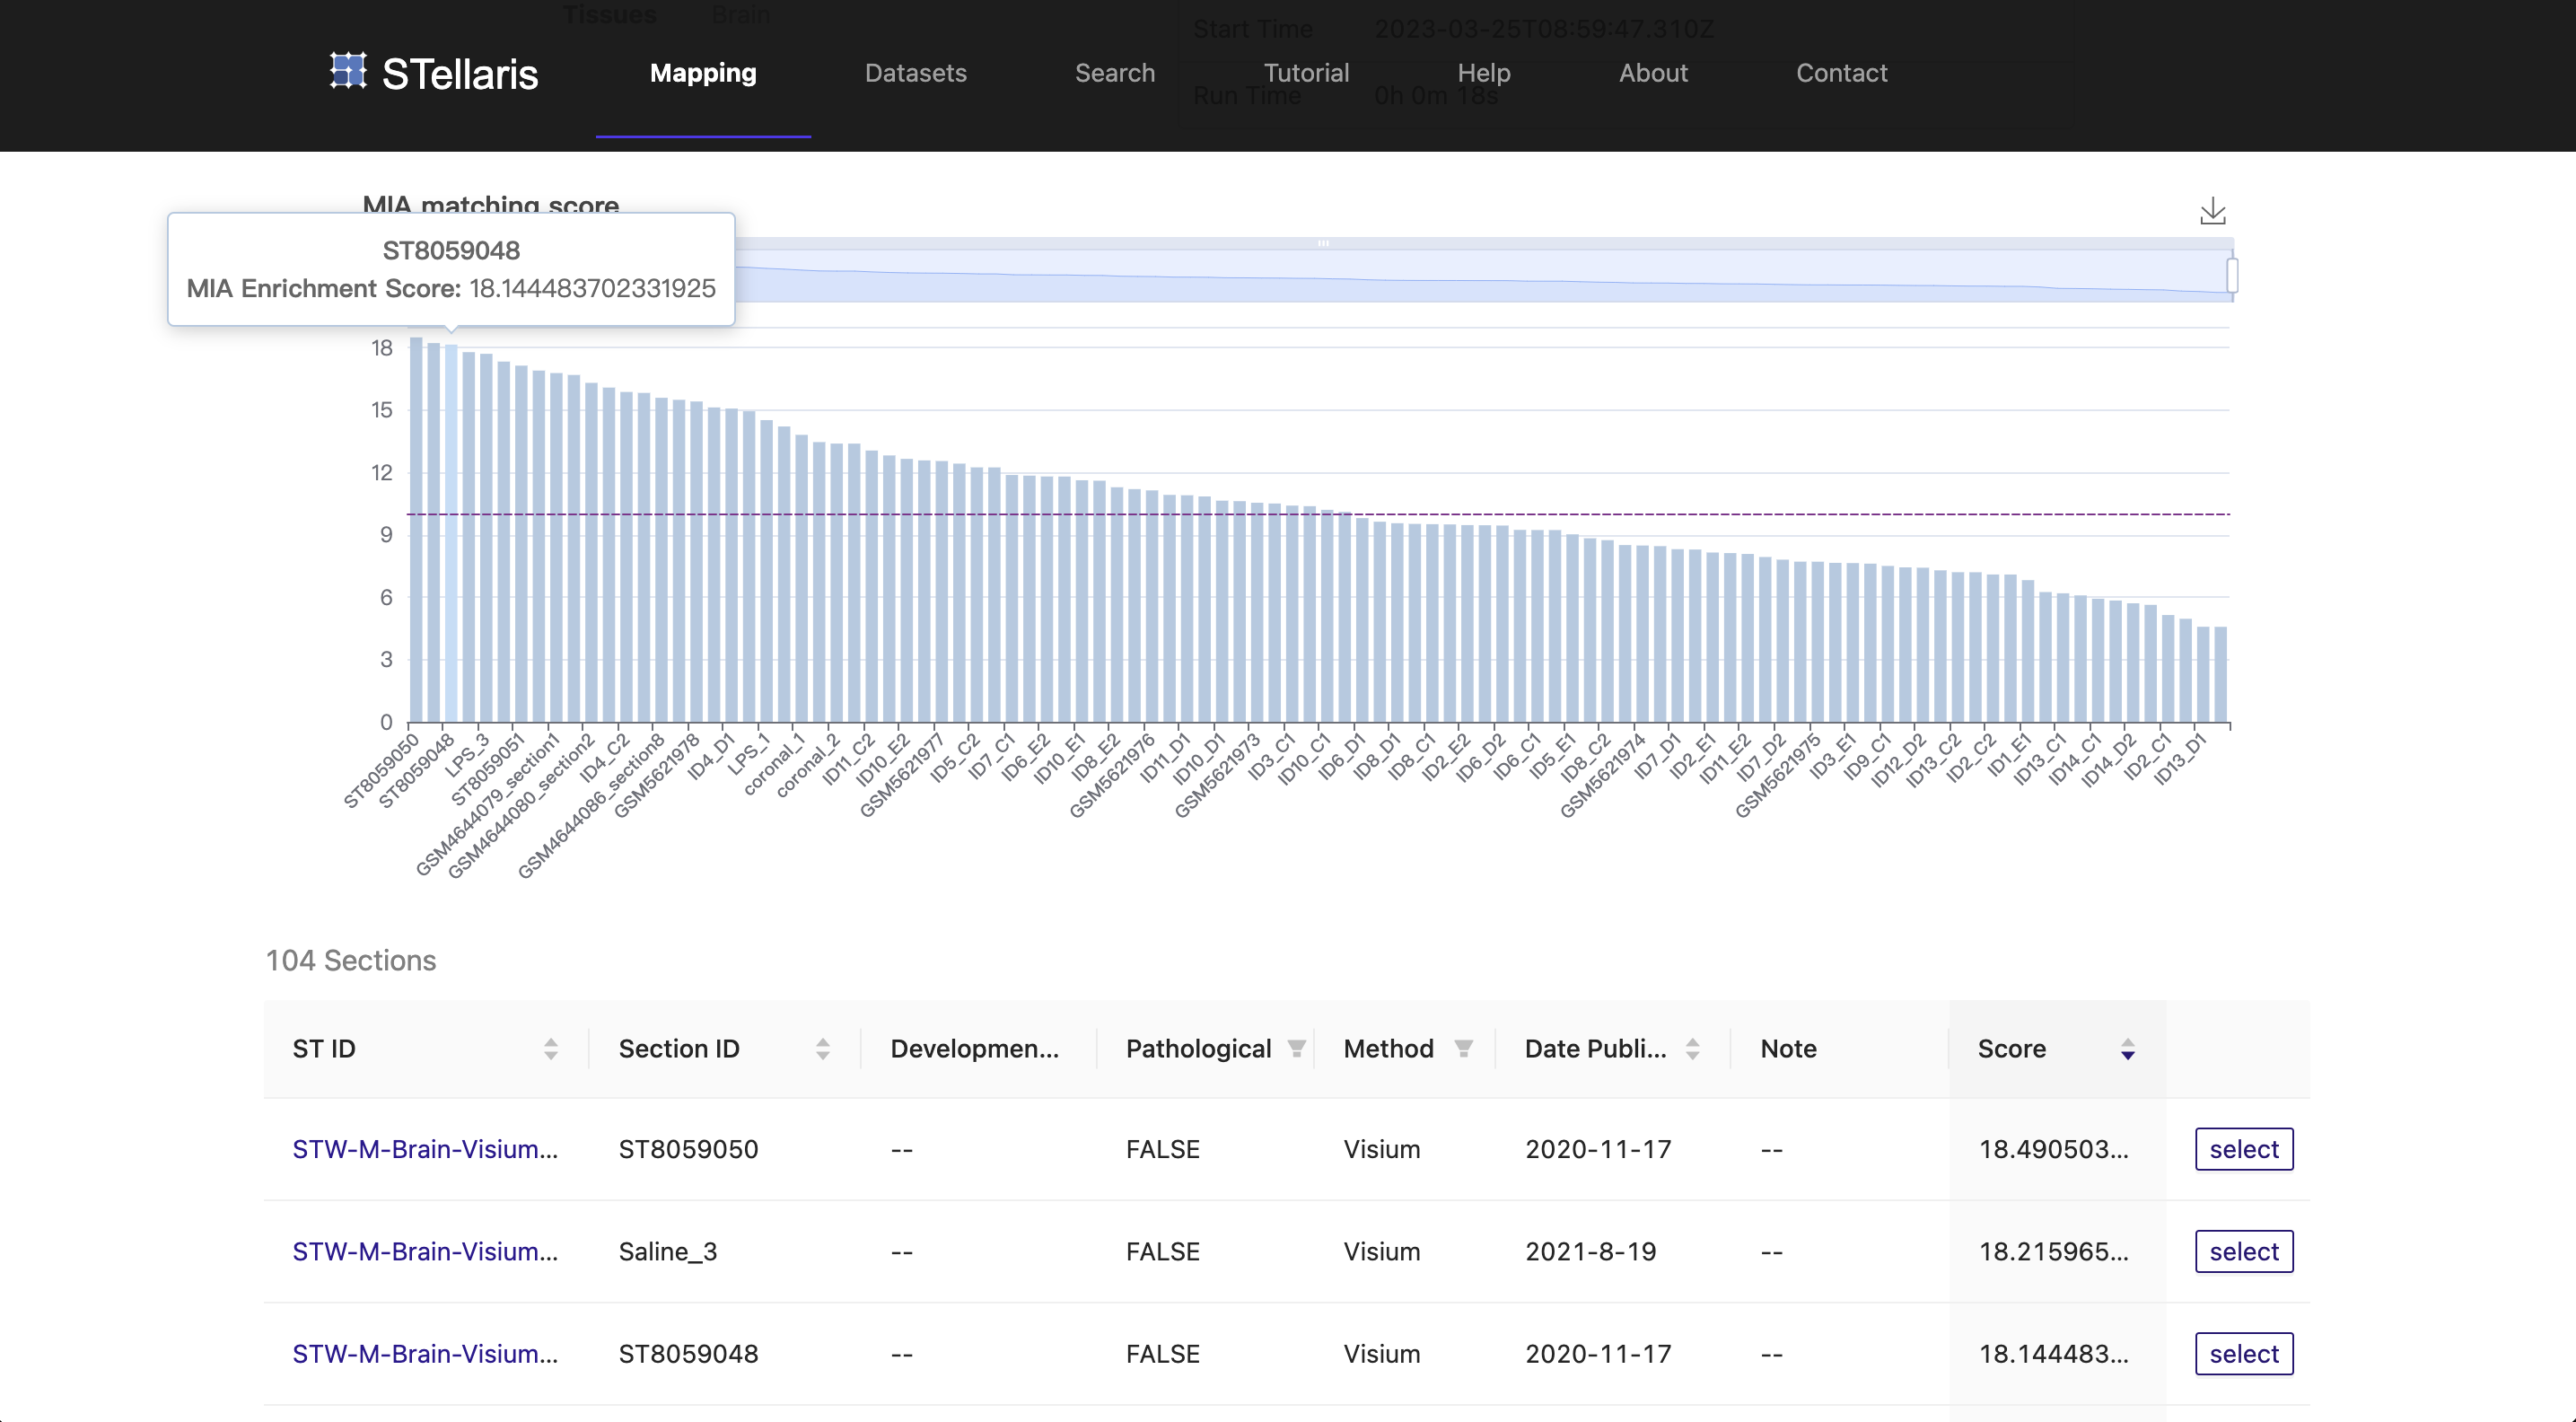
Based on the section blast results and quality of ST sections, we select the third-ranked ST section (ST8059048) from the mouse brain at P56, which was profiled using 10x Visium technology ( STW-M-Brain-Visium-3, ST8059048 ).
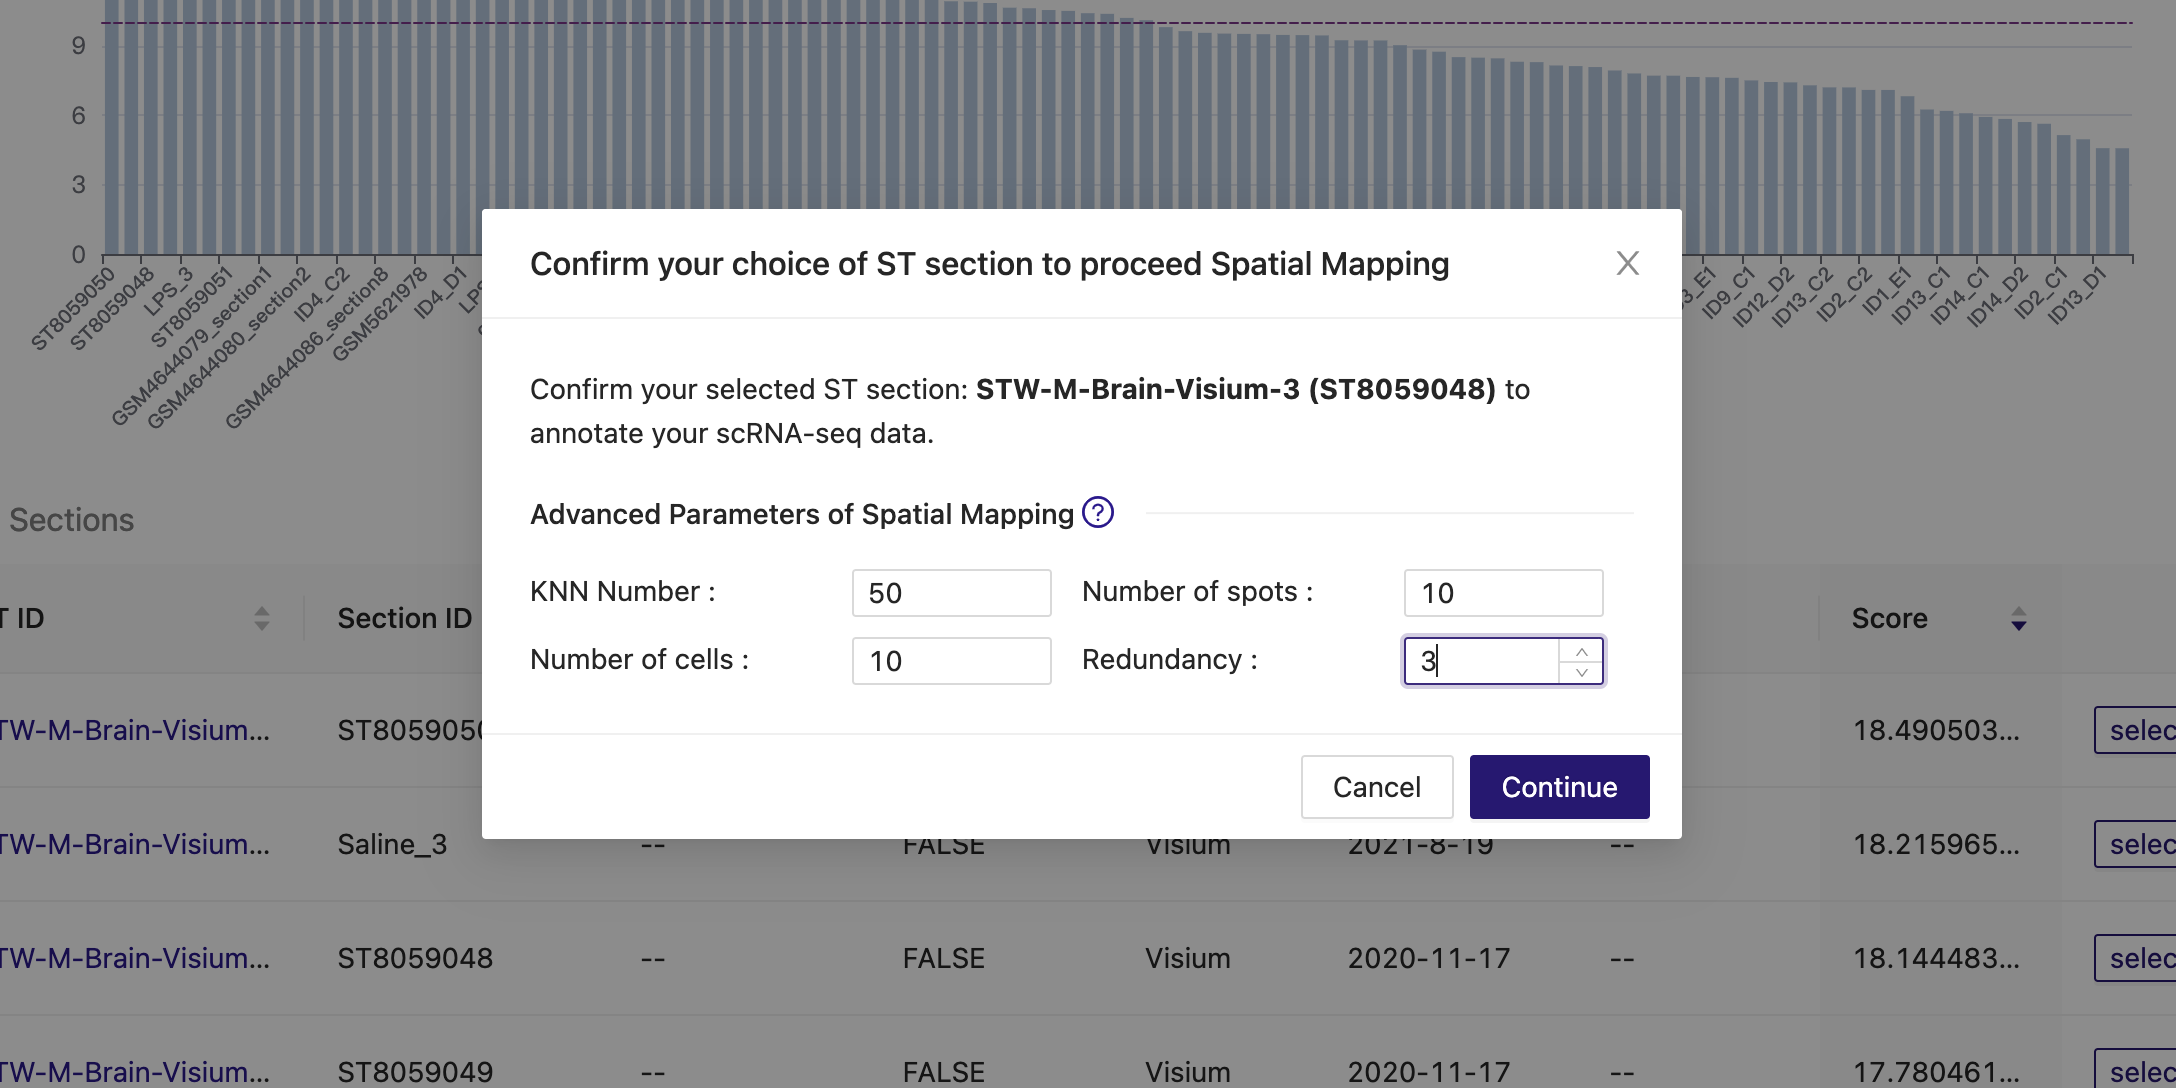
We then perform spatial mapping with the "redundancy" parameter set to 3.
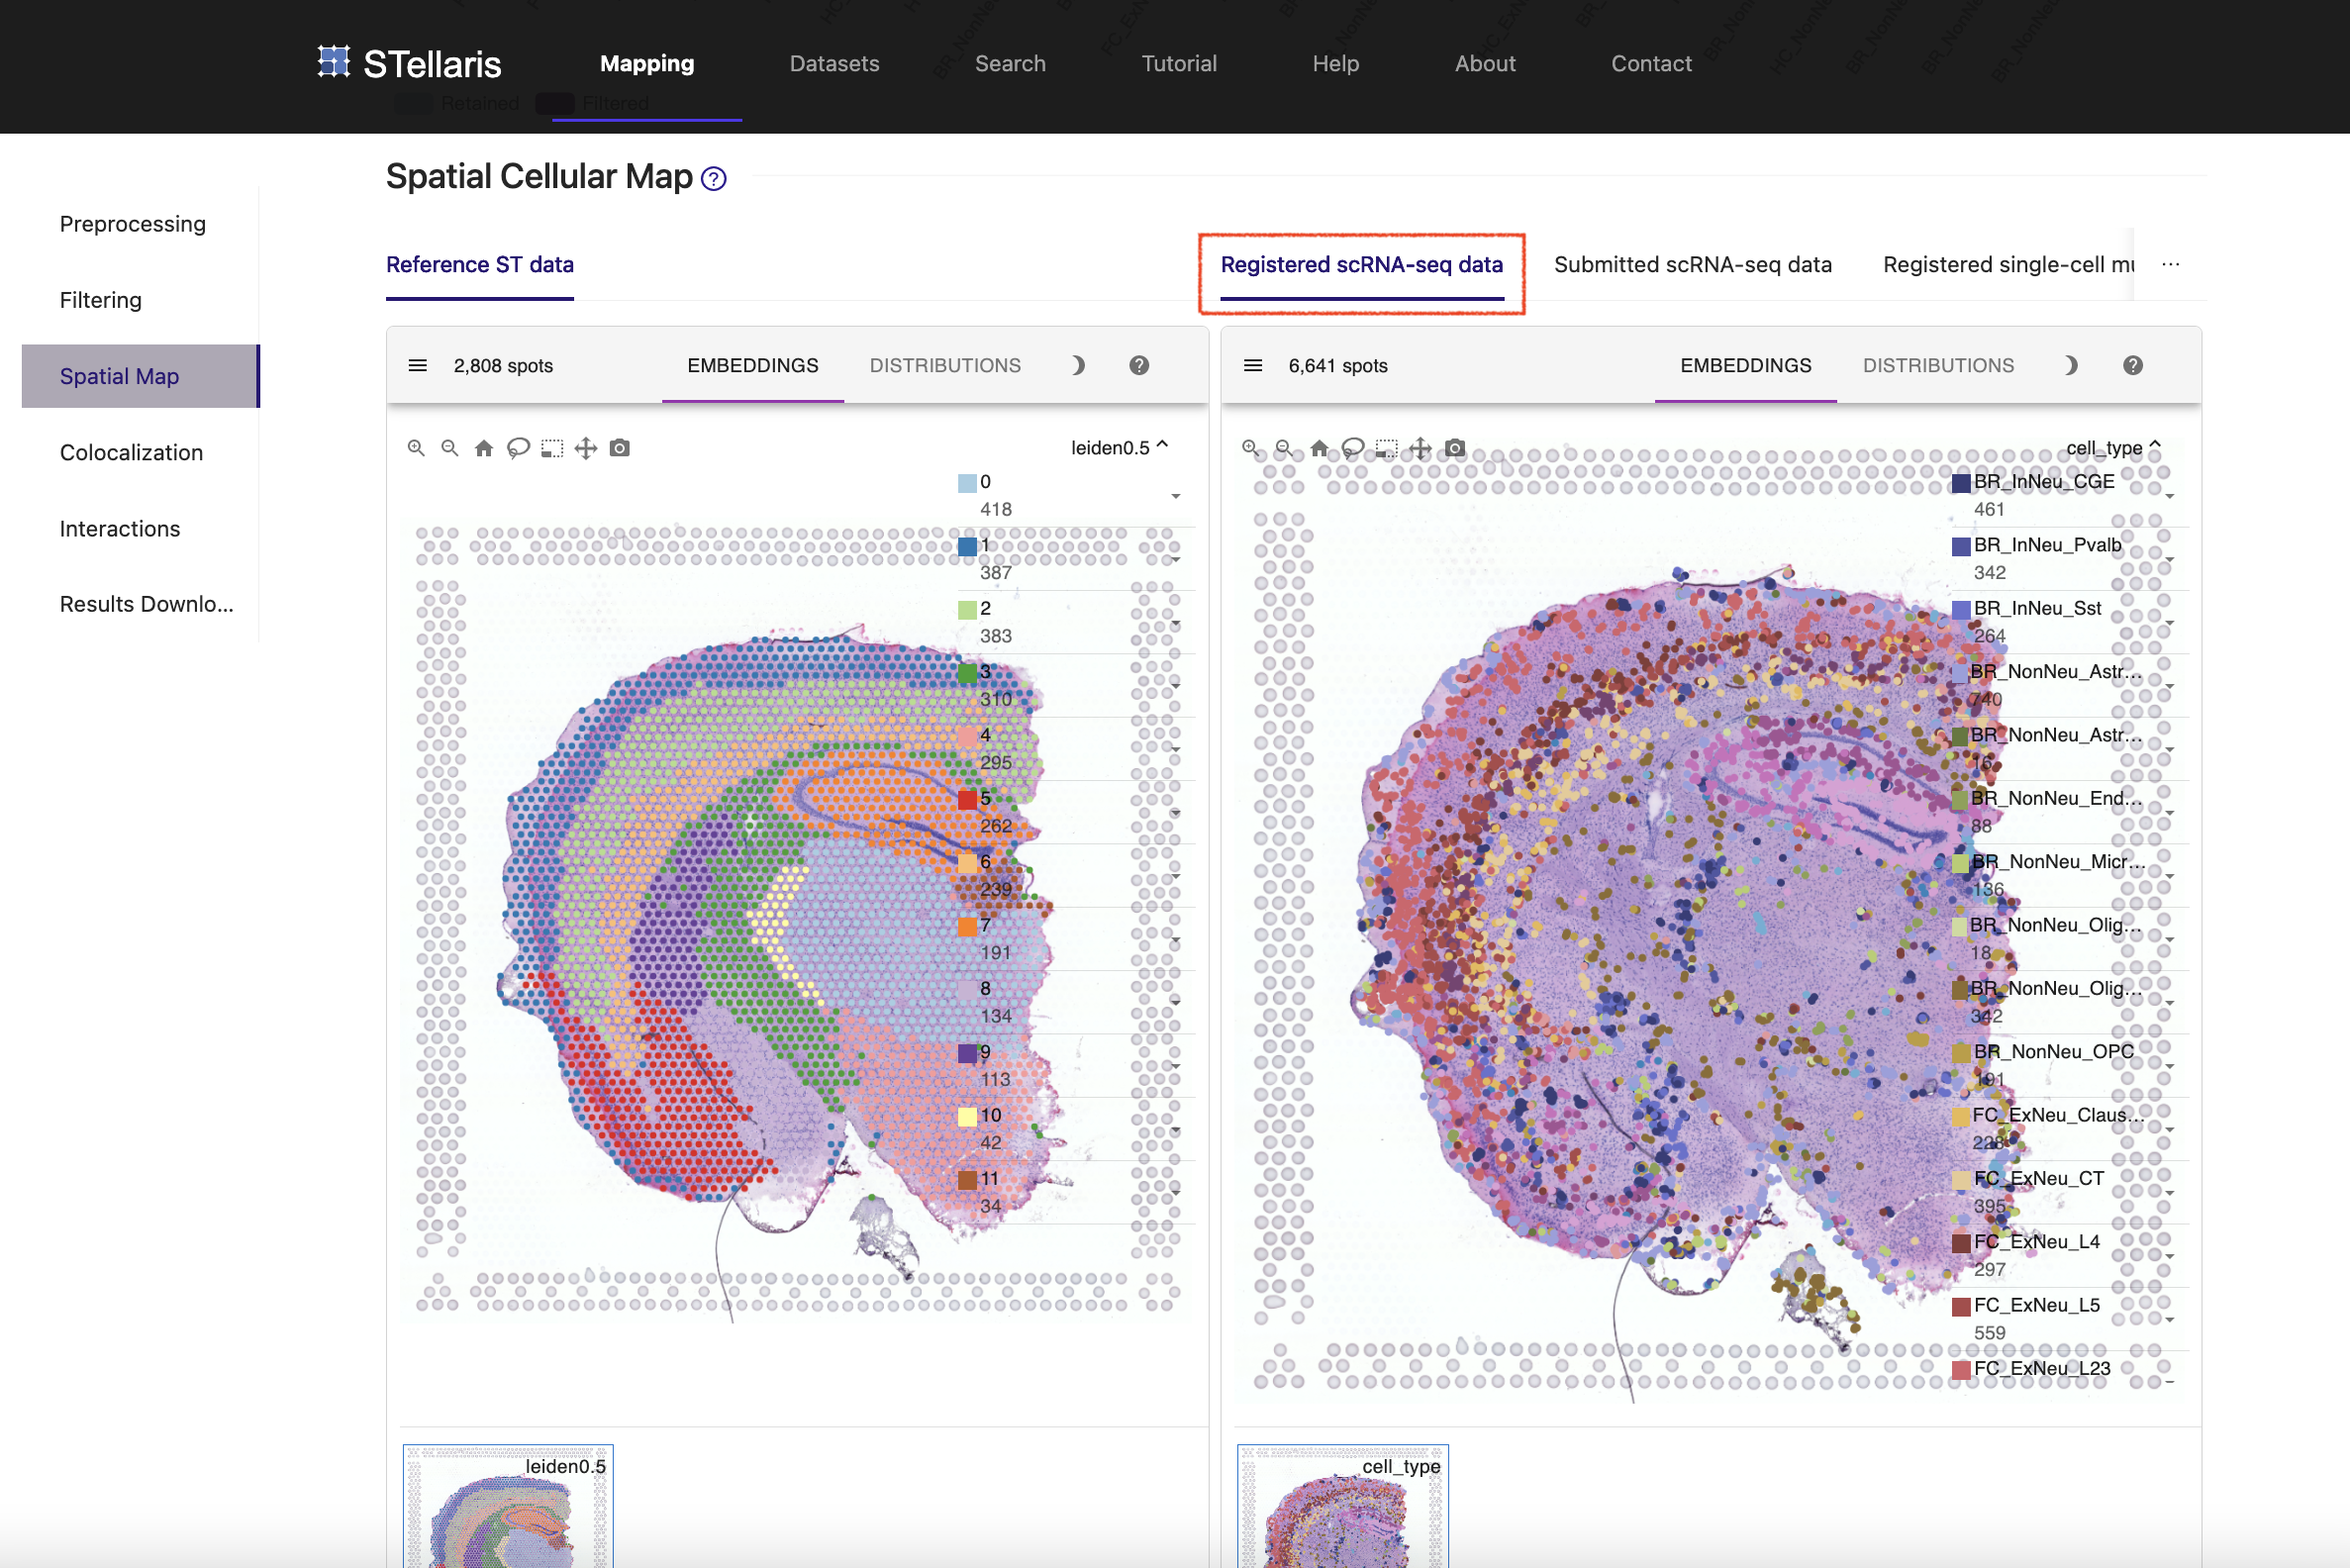
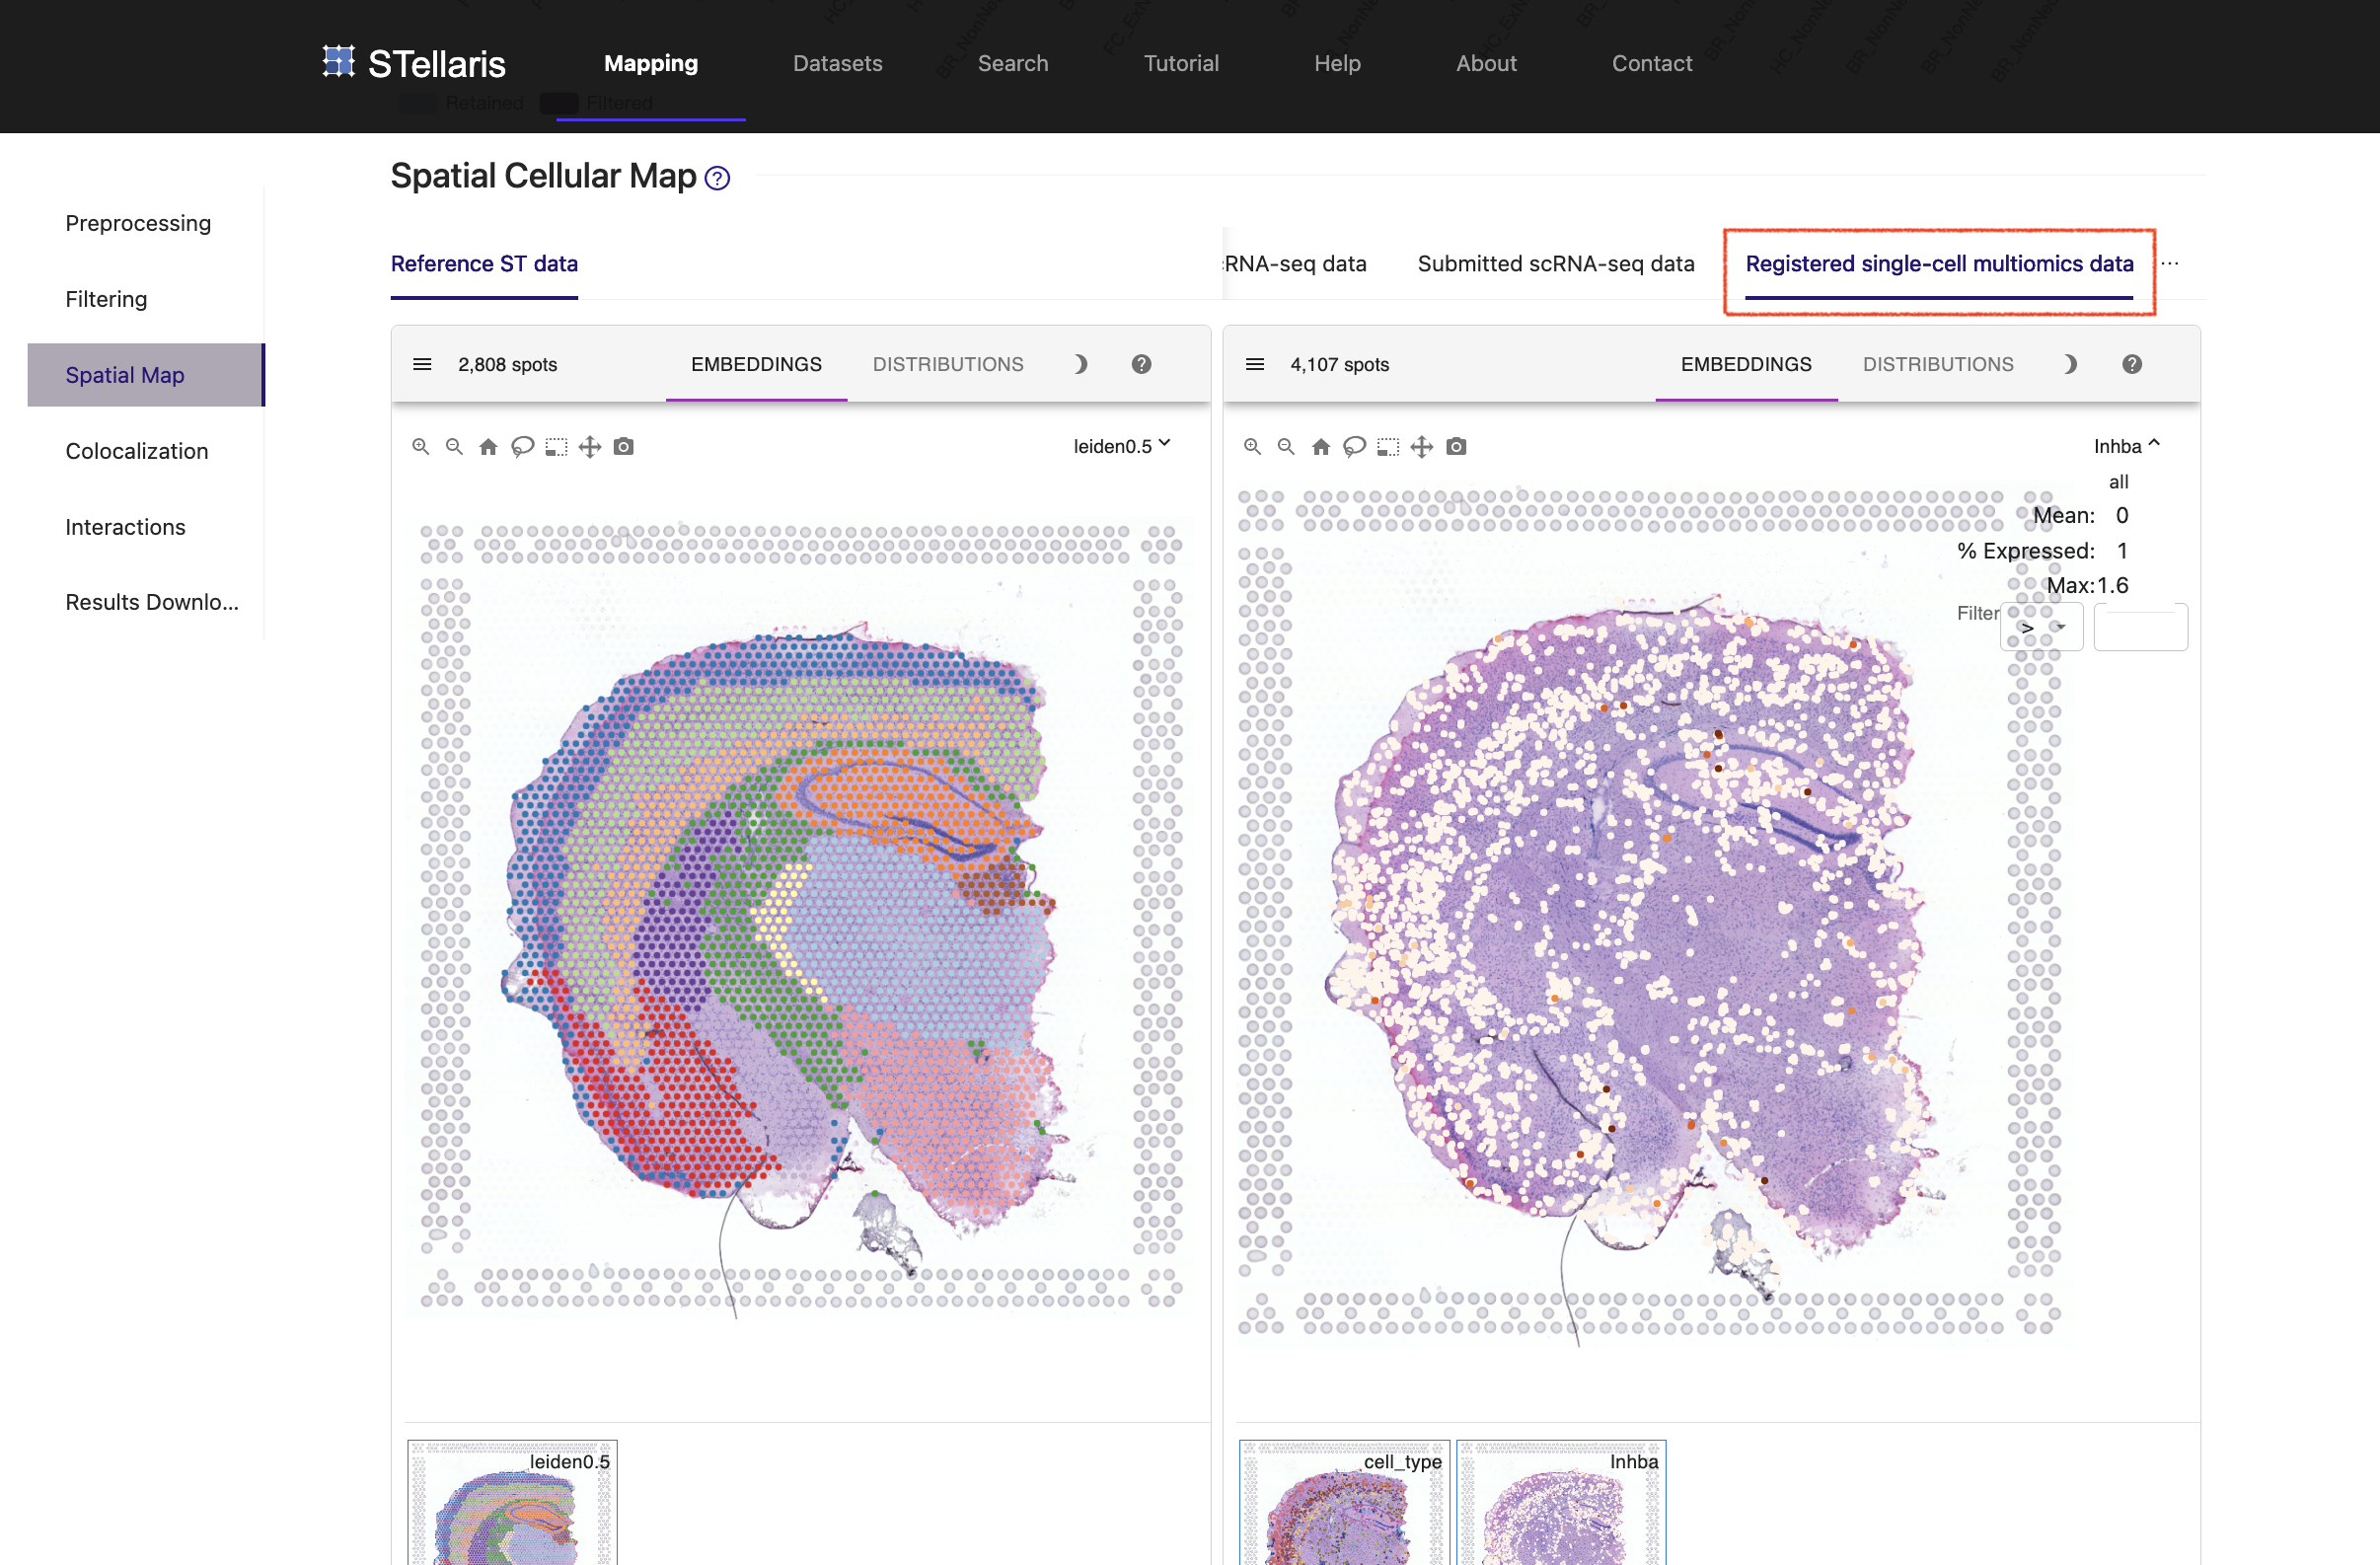
This returns a tissue-wide transcriptomic map, along with a spatial atlas of H3K4me3 modification in the active promoters of 127 genes.
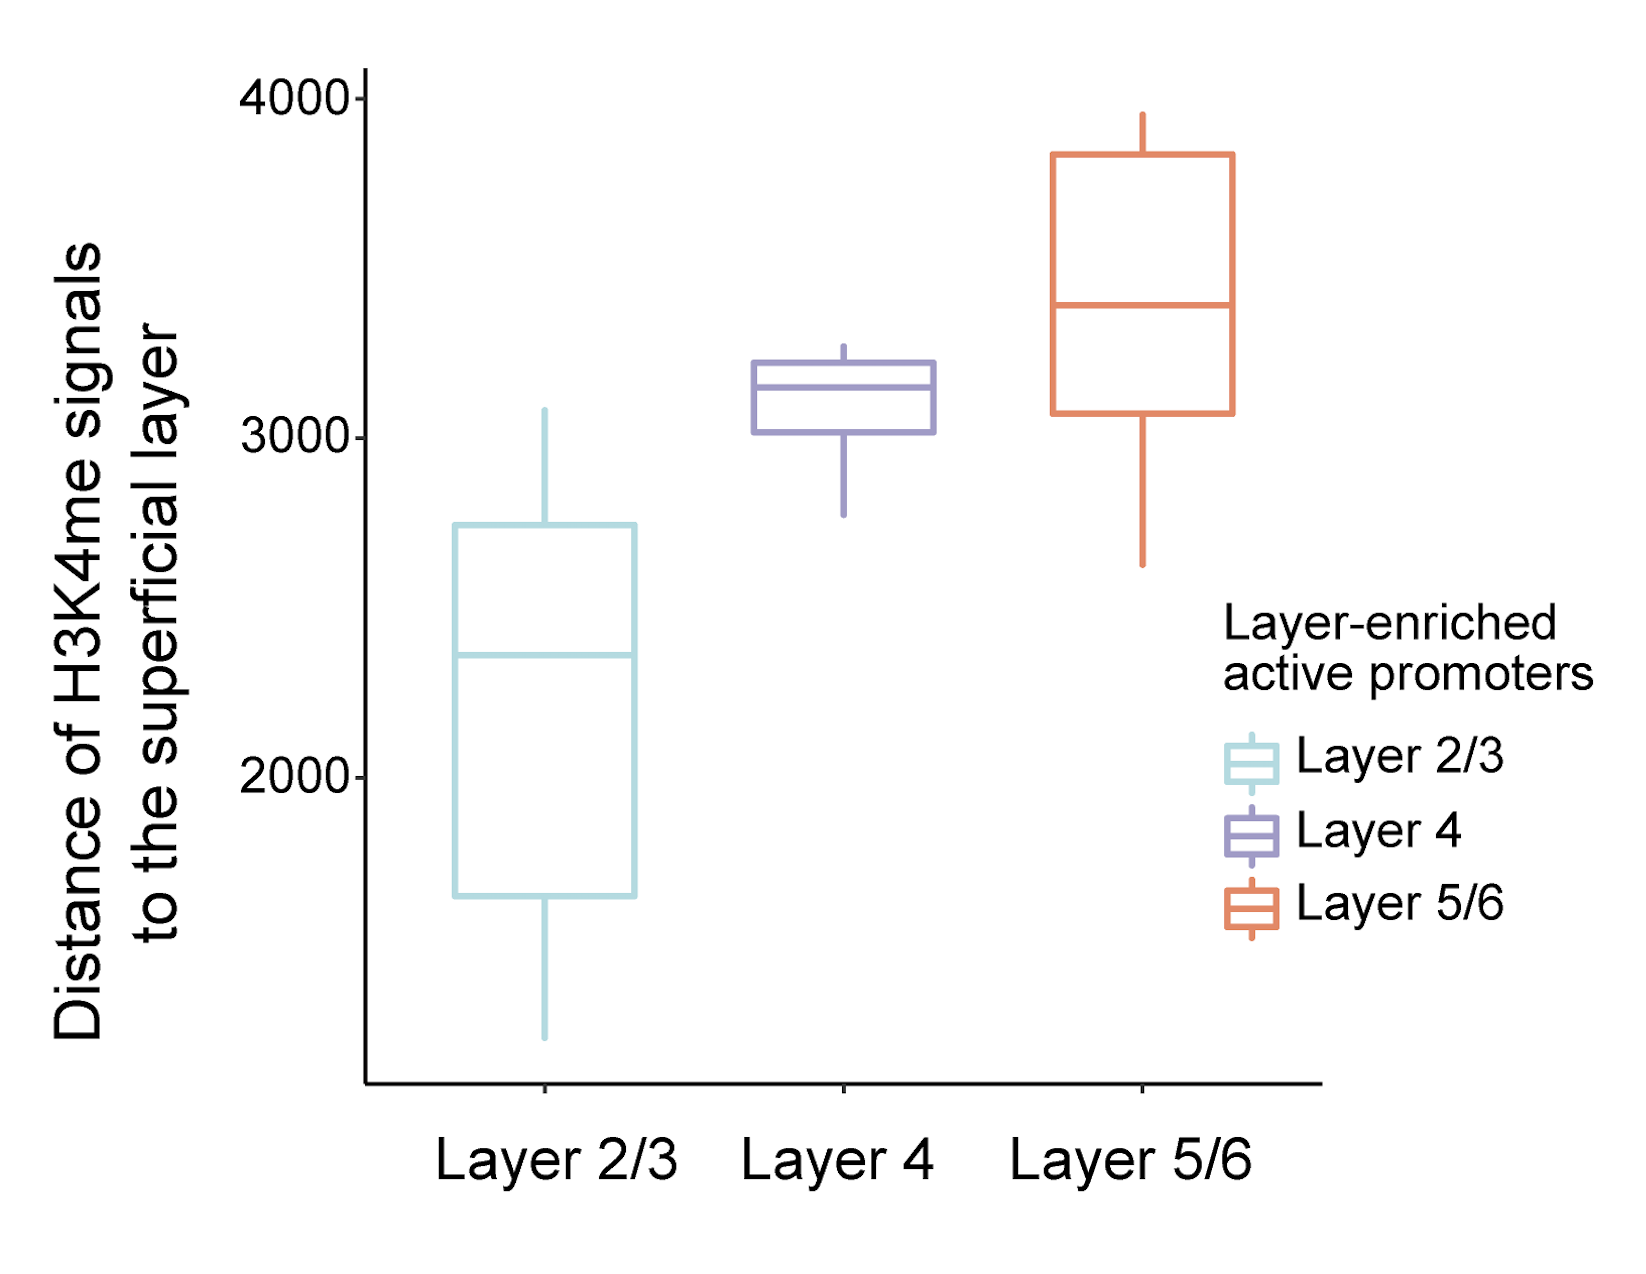
Next, to validate the accuracy of the epigenomic map generated using STellaris, we extracted the cortex region using polynomial regression and assessed the spatial distributions of layer-enriched active promoters interrogated in the epigenomic MERFISH paper. For each promoter, we calculated the distance of the centroid of H3K4me3 signals to the superficial layer of the cortex.
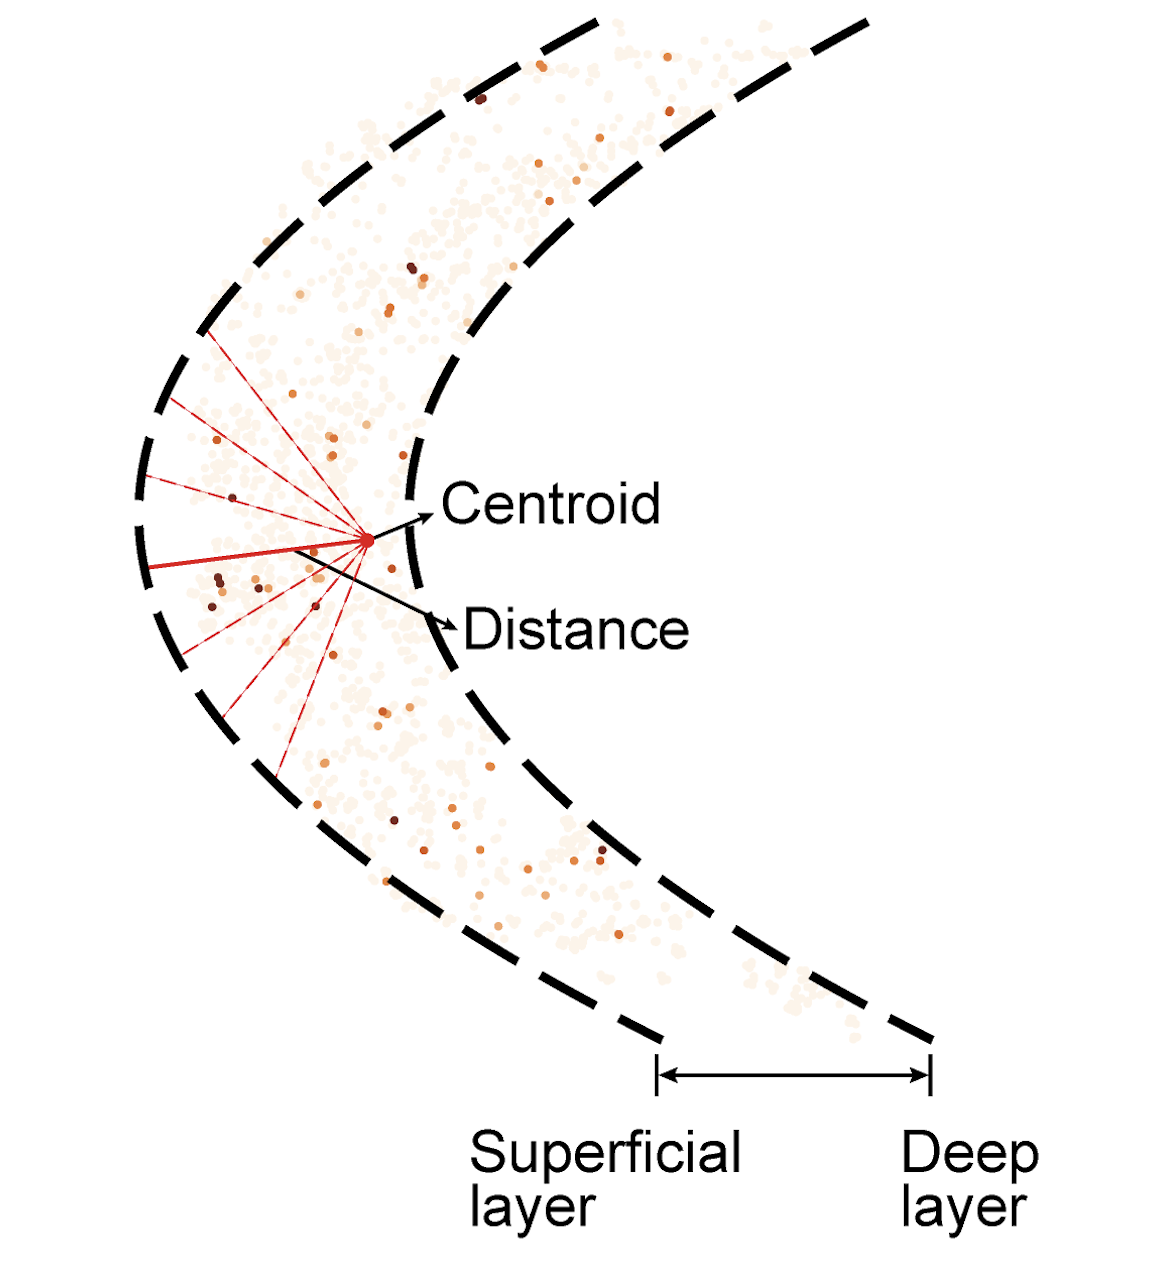
We observed that the distribution patterns of H3K4me3 signals in the layer-enriched promoters in our epigenomic map (right) nicely recapitulate those directly profiled using epigenomic MERFISH paper (left).

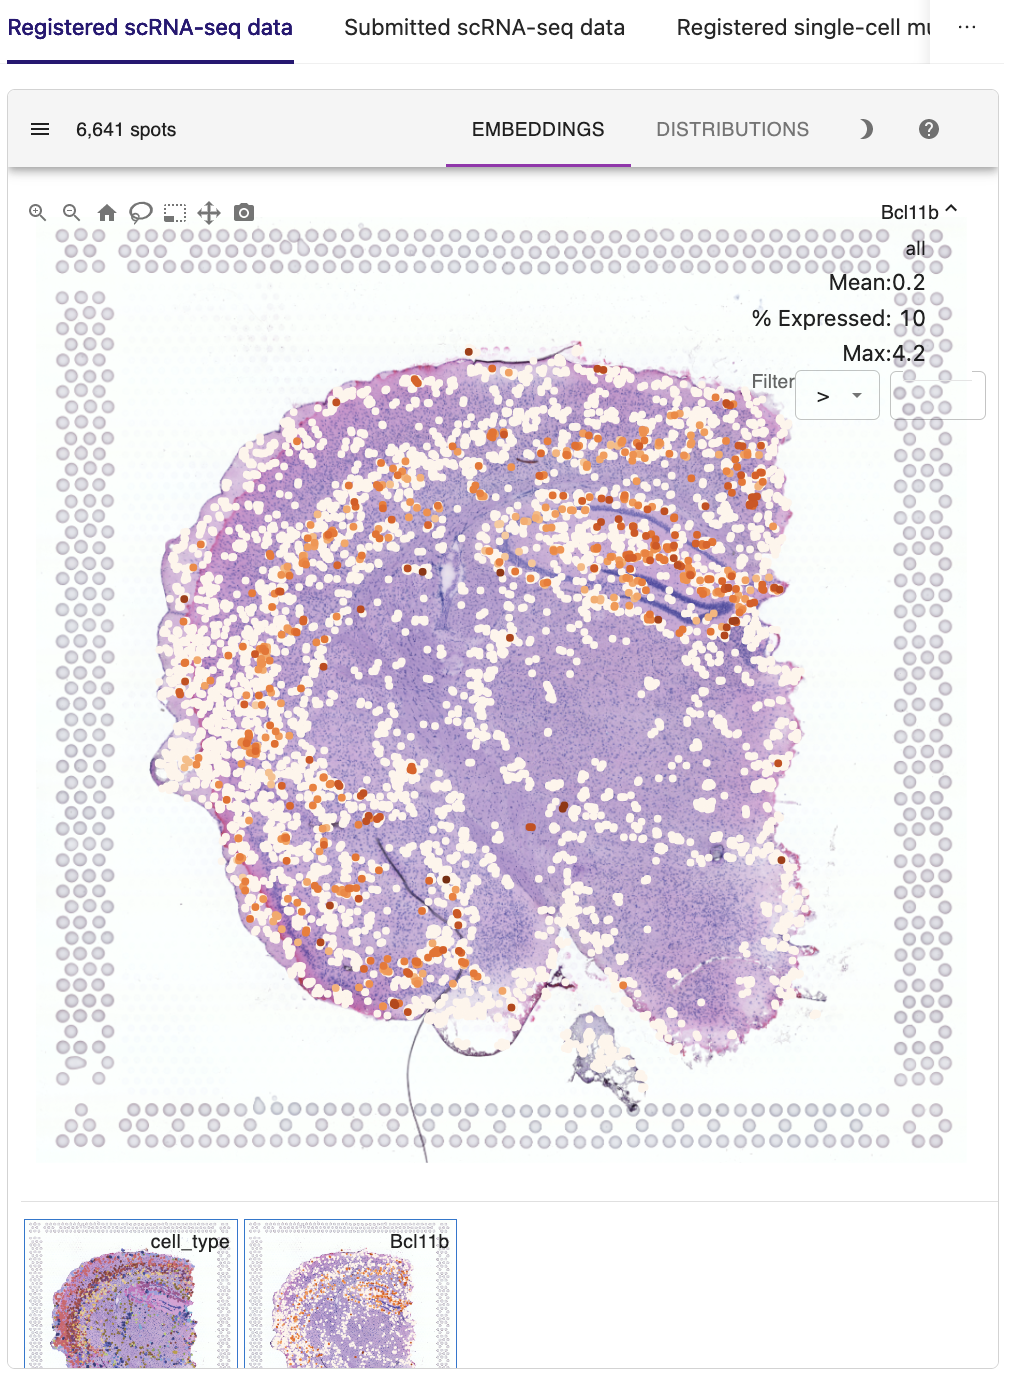
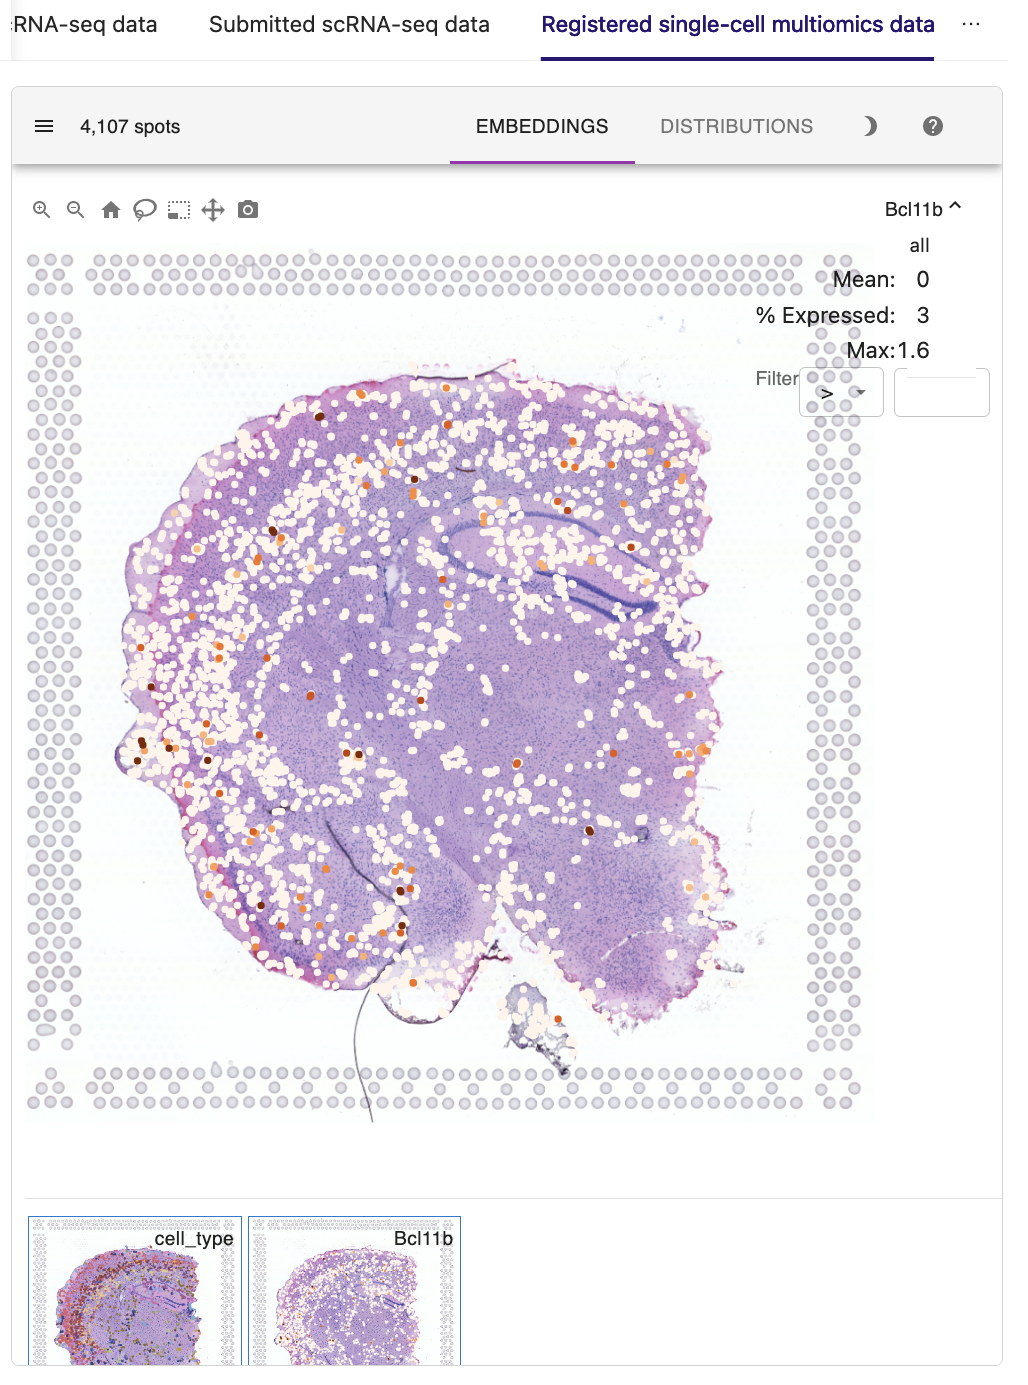
Based on the accurate spatial patterning of H3K4me3 modification, we then investigated whether the H3K4me3 signals of promoter loci exhibited consistent layer enrichment with the expression of their corresponding genes. For example, the spatial pattern of gene expression of Bcl11b, a marker of early-born deep-layer neurons, are in good agreement with the H3K4me3 epigenomic signals in its promoter, suggesting the potential regulation of gene expression at the tissue scale.
Taken together, these results demonstrate the feasibility of using STellaris to characterize gene regulatory mechanisms for single-cell multiomics data in the spatial context.