Dataset Browser
This tutorial aims to show you how to retrieve and view our datasets, the data basis for the spatial mapping tool, by dataset browser (https://spatial.rhesusbase.com/datasets).
We collected 101 spatial transcriptomics (ST) datasets comprising 823 sections across organs, developmental stages and pathological states in humans and mice. All curated ST datasets were uniformly processed using centralized pipelines. We have designed this interface to help you navigate through this catalog. Select the ST data that you are interested in and explore the spatially resolved expression profiles of candidate genes.
Here we will use a ST data derived from postnatal mouse brain (P8) using 10X Visium technique as an example.
1. Click "Datasets" tab in navigator bar on the top. The bar charts summarize the number of ST datasets or sections in humans and mice compiled by our development team.
2. Click "Mouse Archive" to browser ST data of mouse.

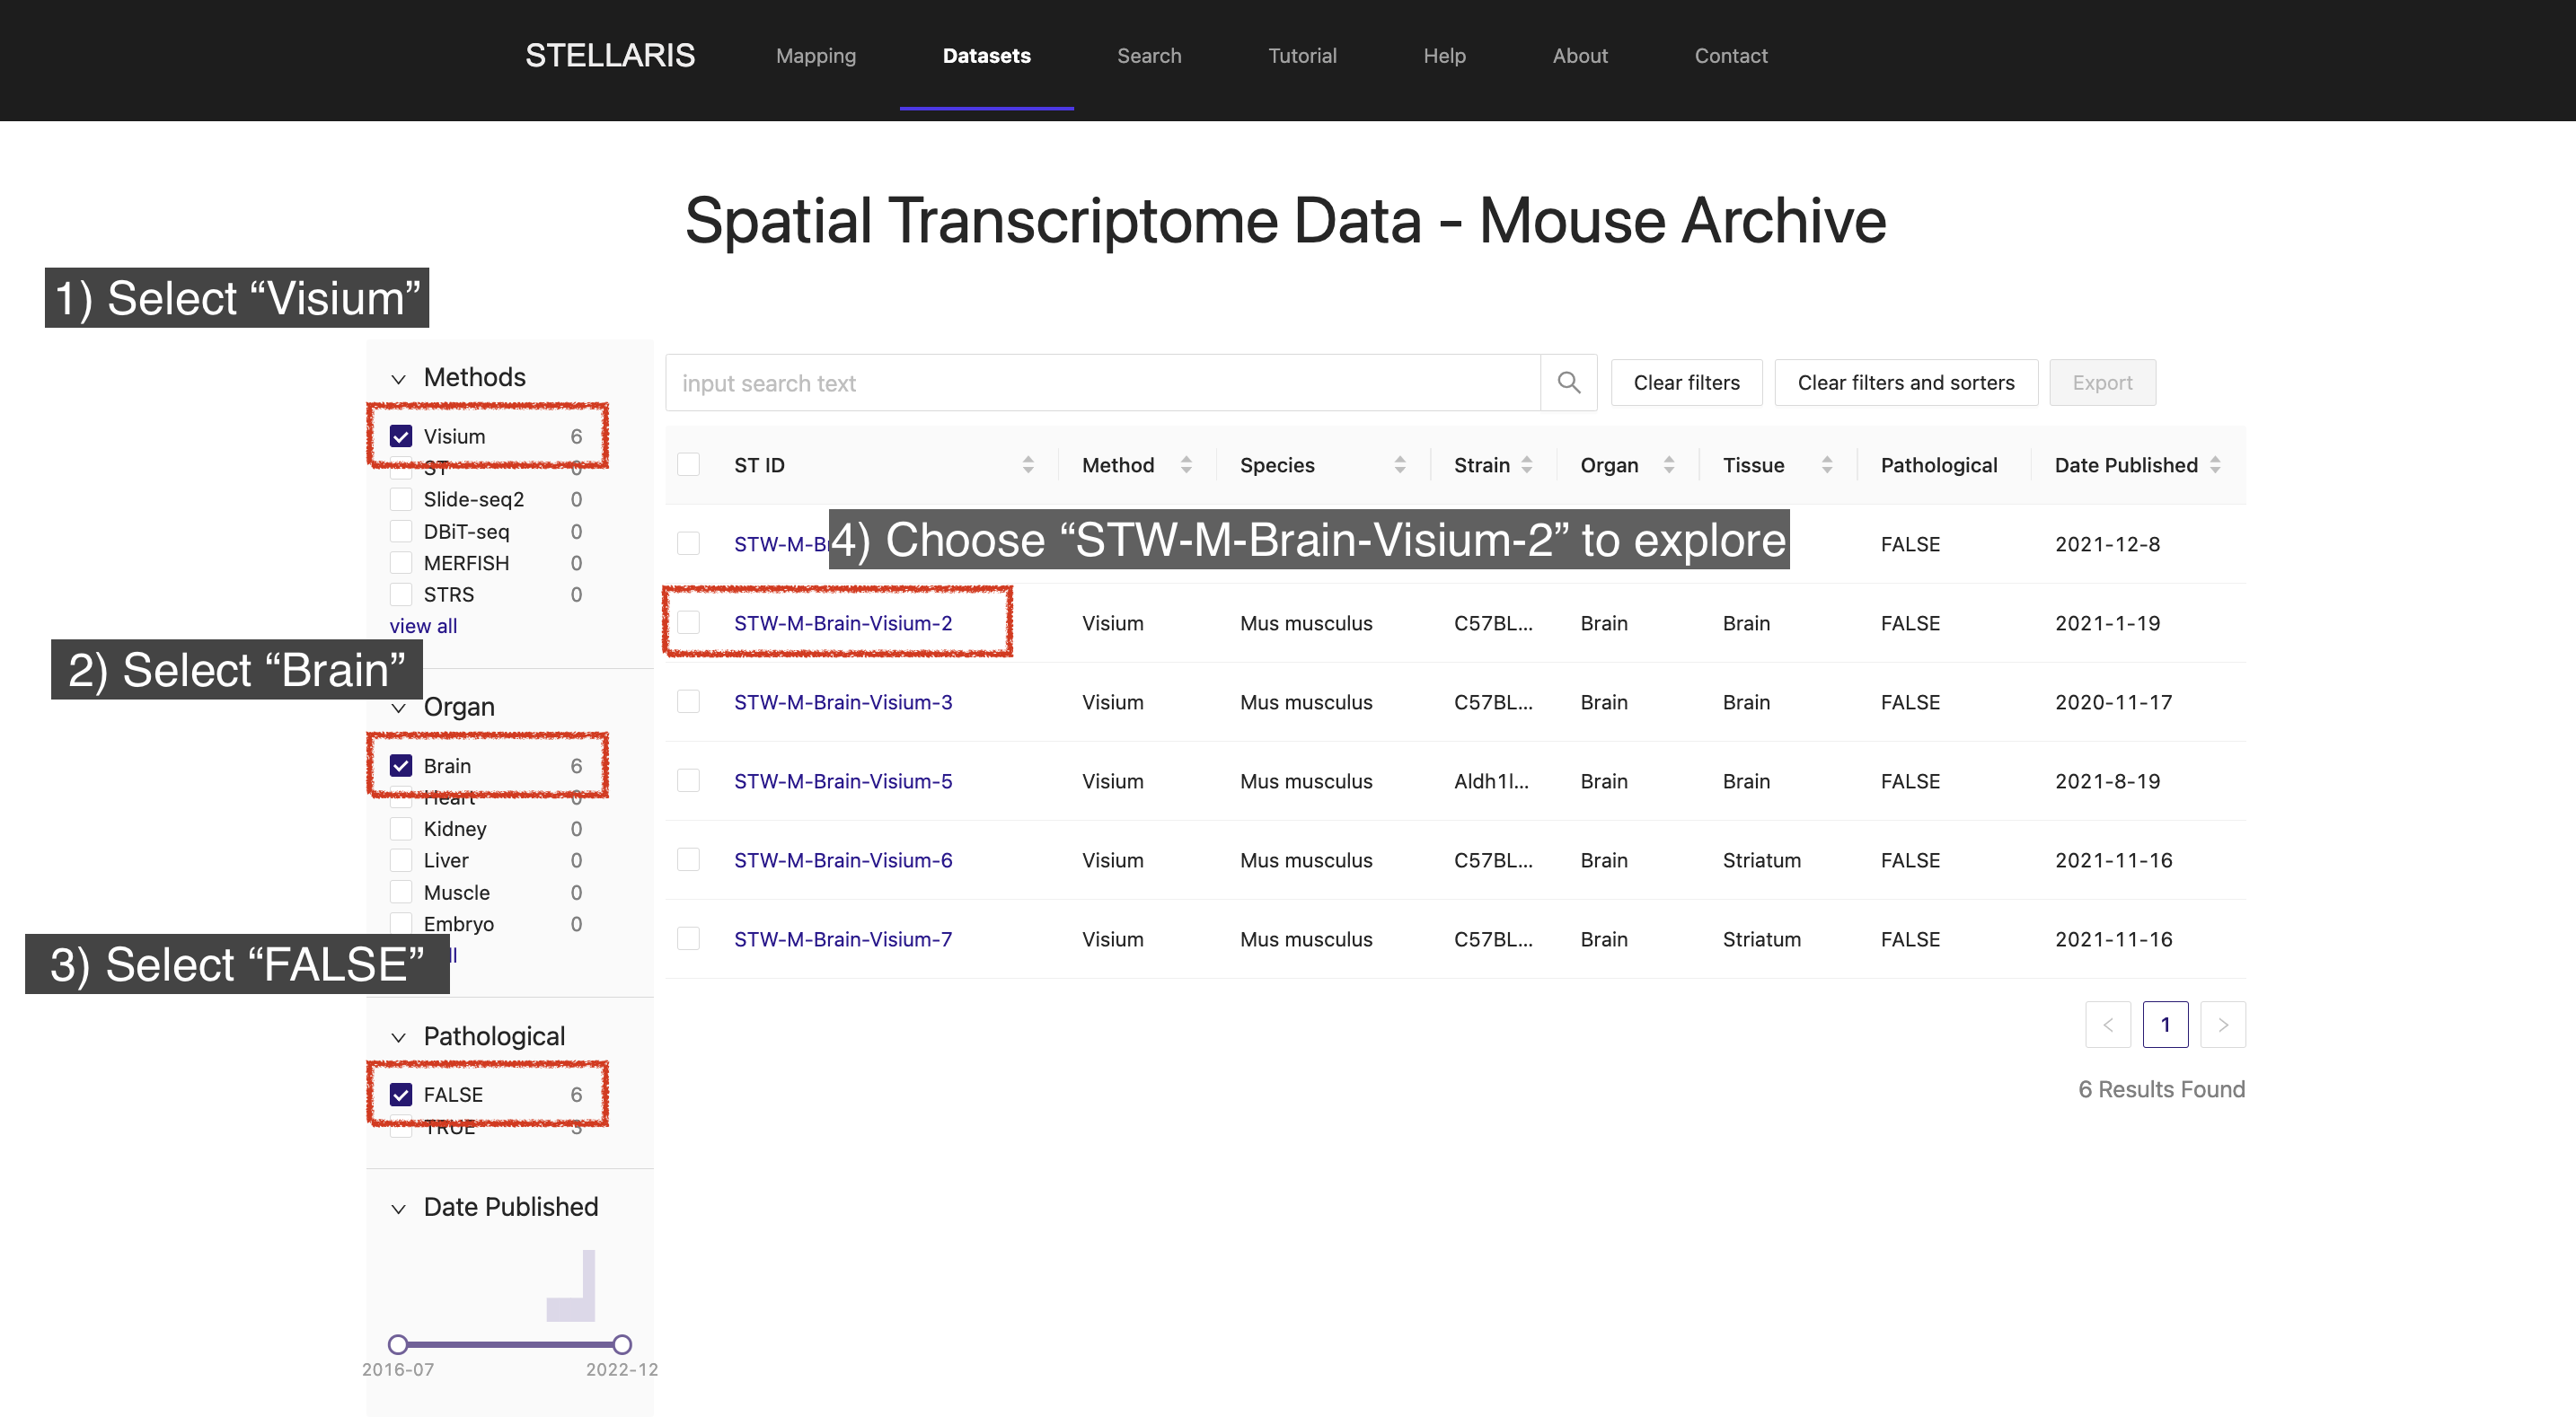
3. Choose the ST method, organ and pathological state of your interest to screen the ST datasets. Here we select "Visium", "Brain" and "FALSE" for these three attributes, respectively, and then choose "STW-M-Brain-Visium-2" to explore.
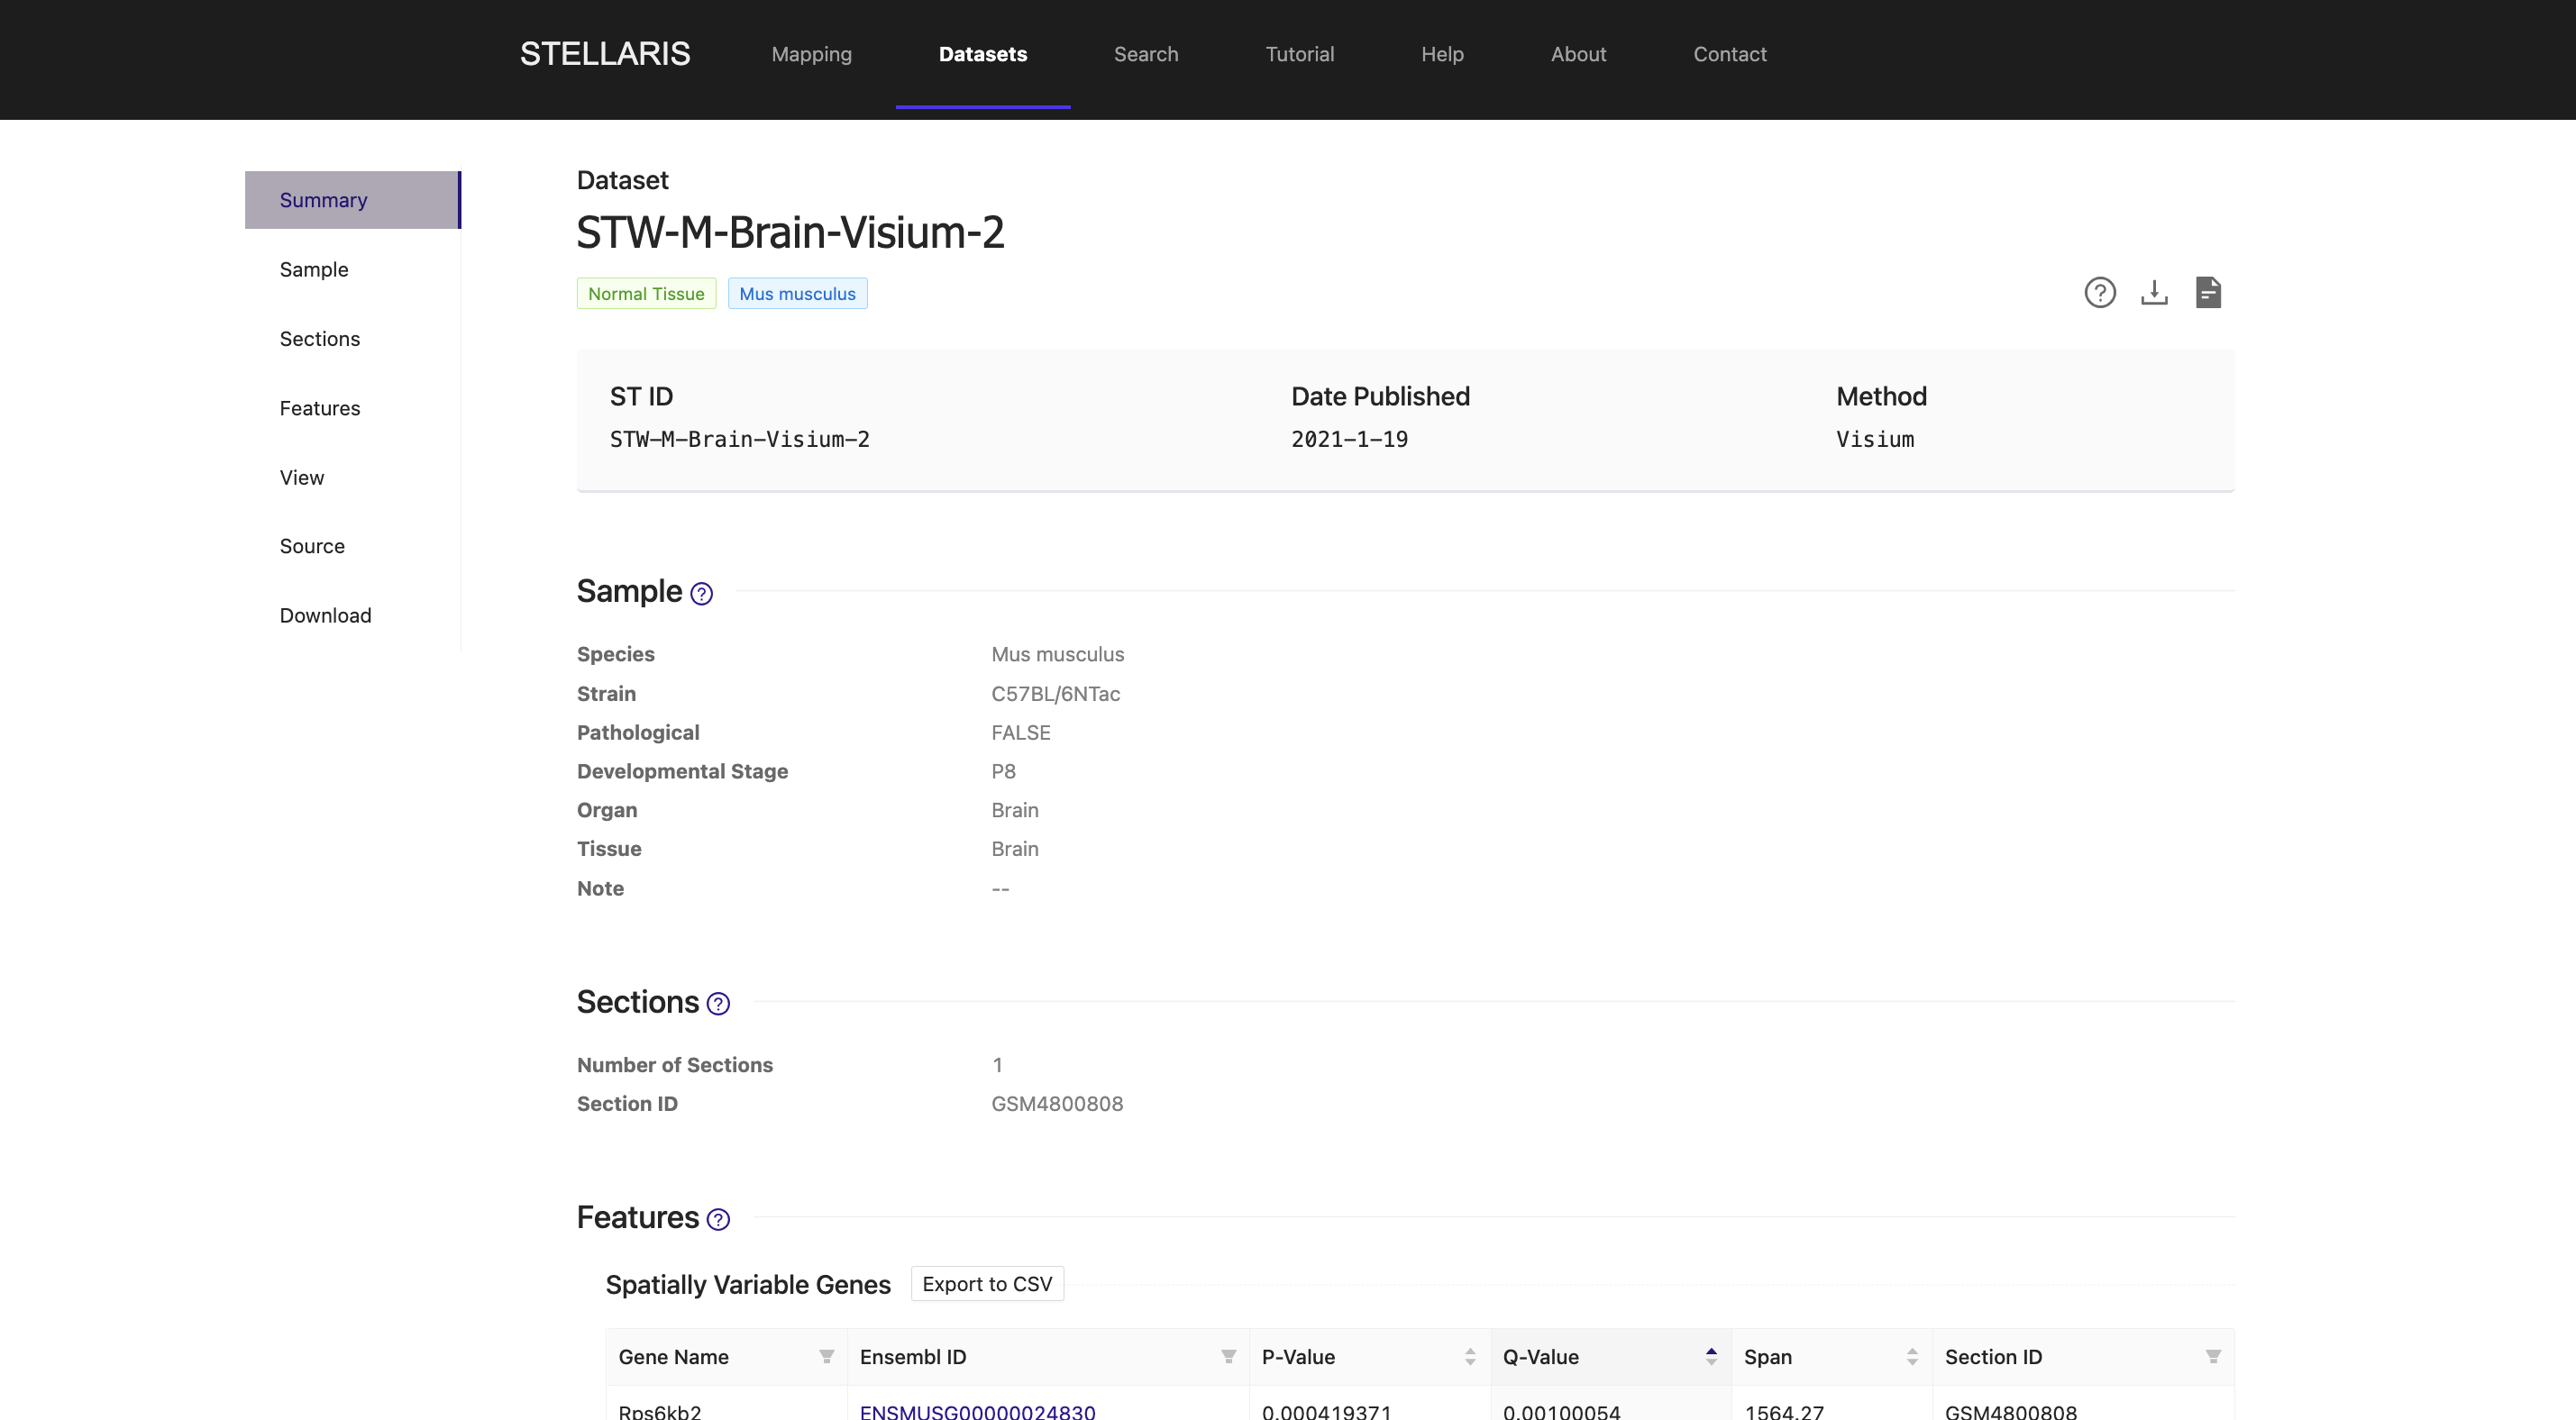
4. View the meta information for this ST dataset, which includes details on the sample and section information associated with this dataset.
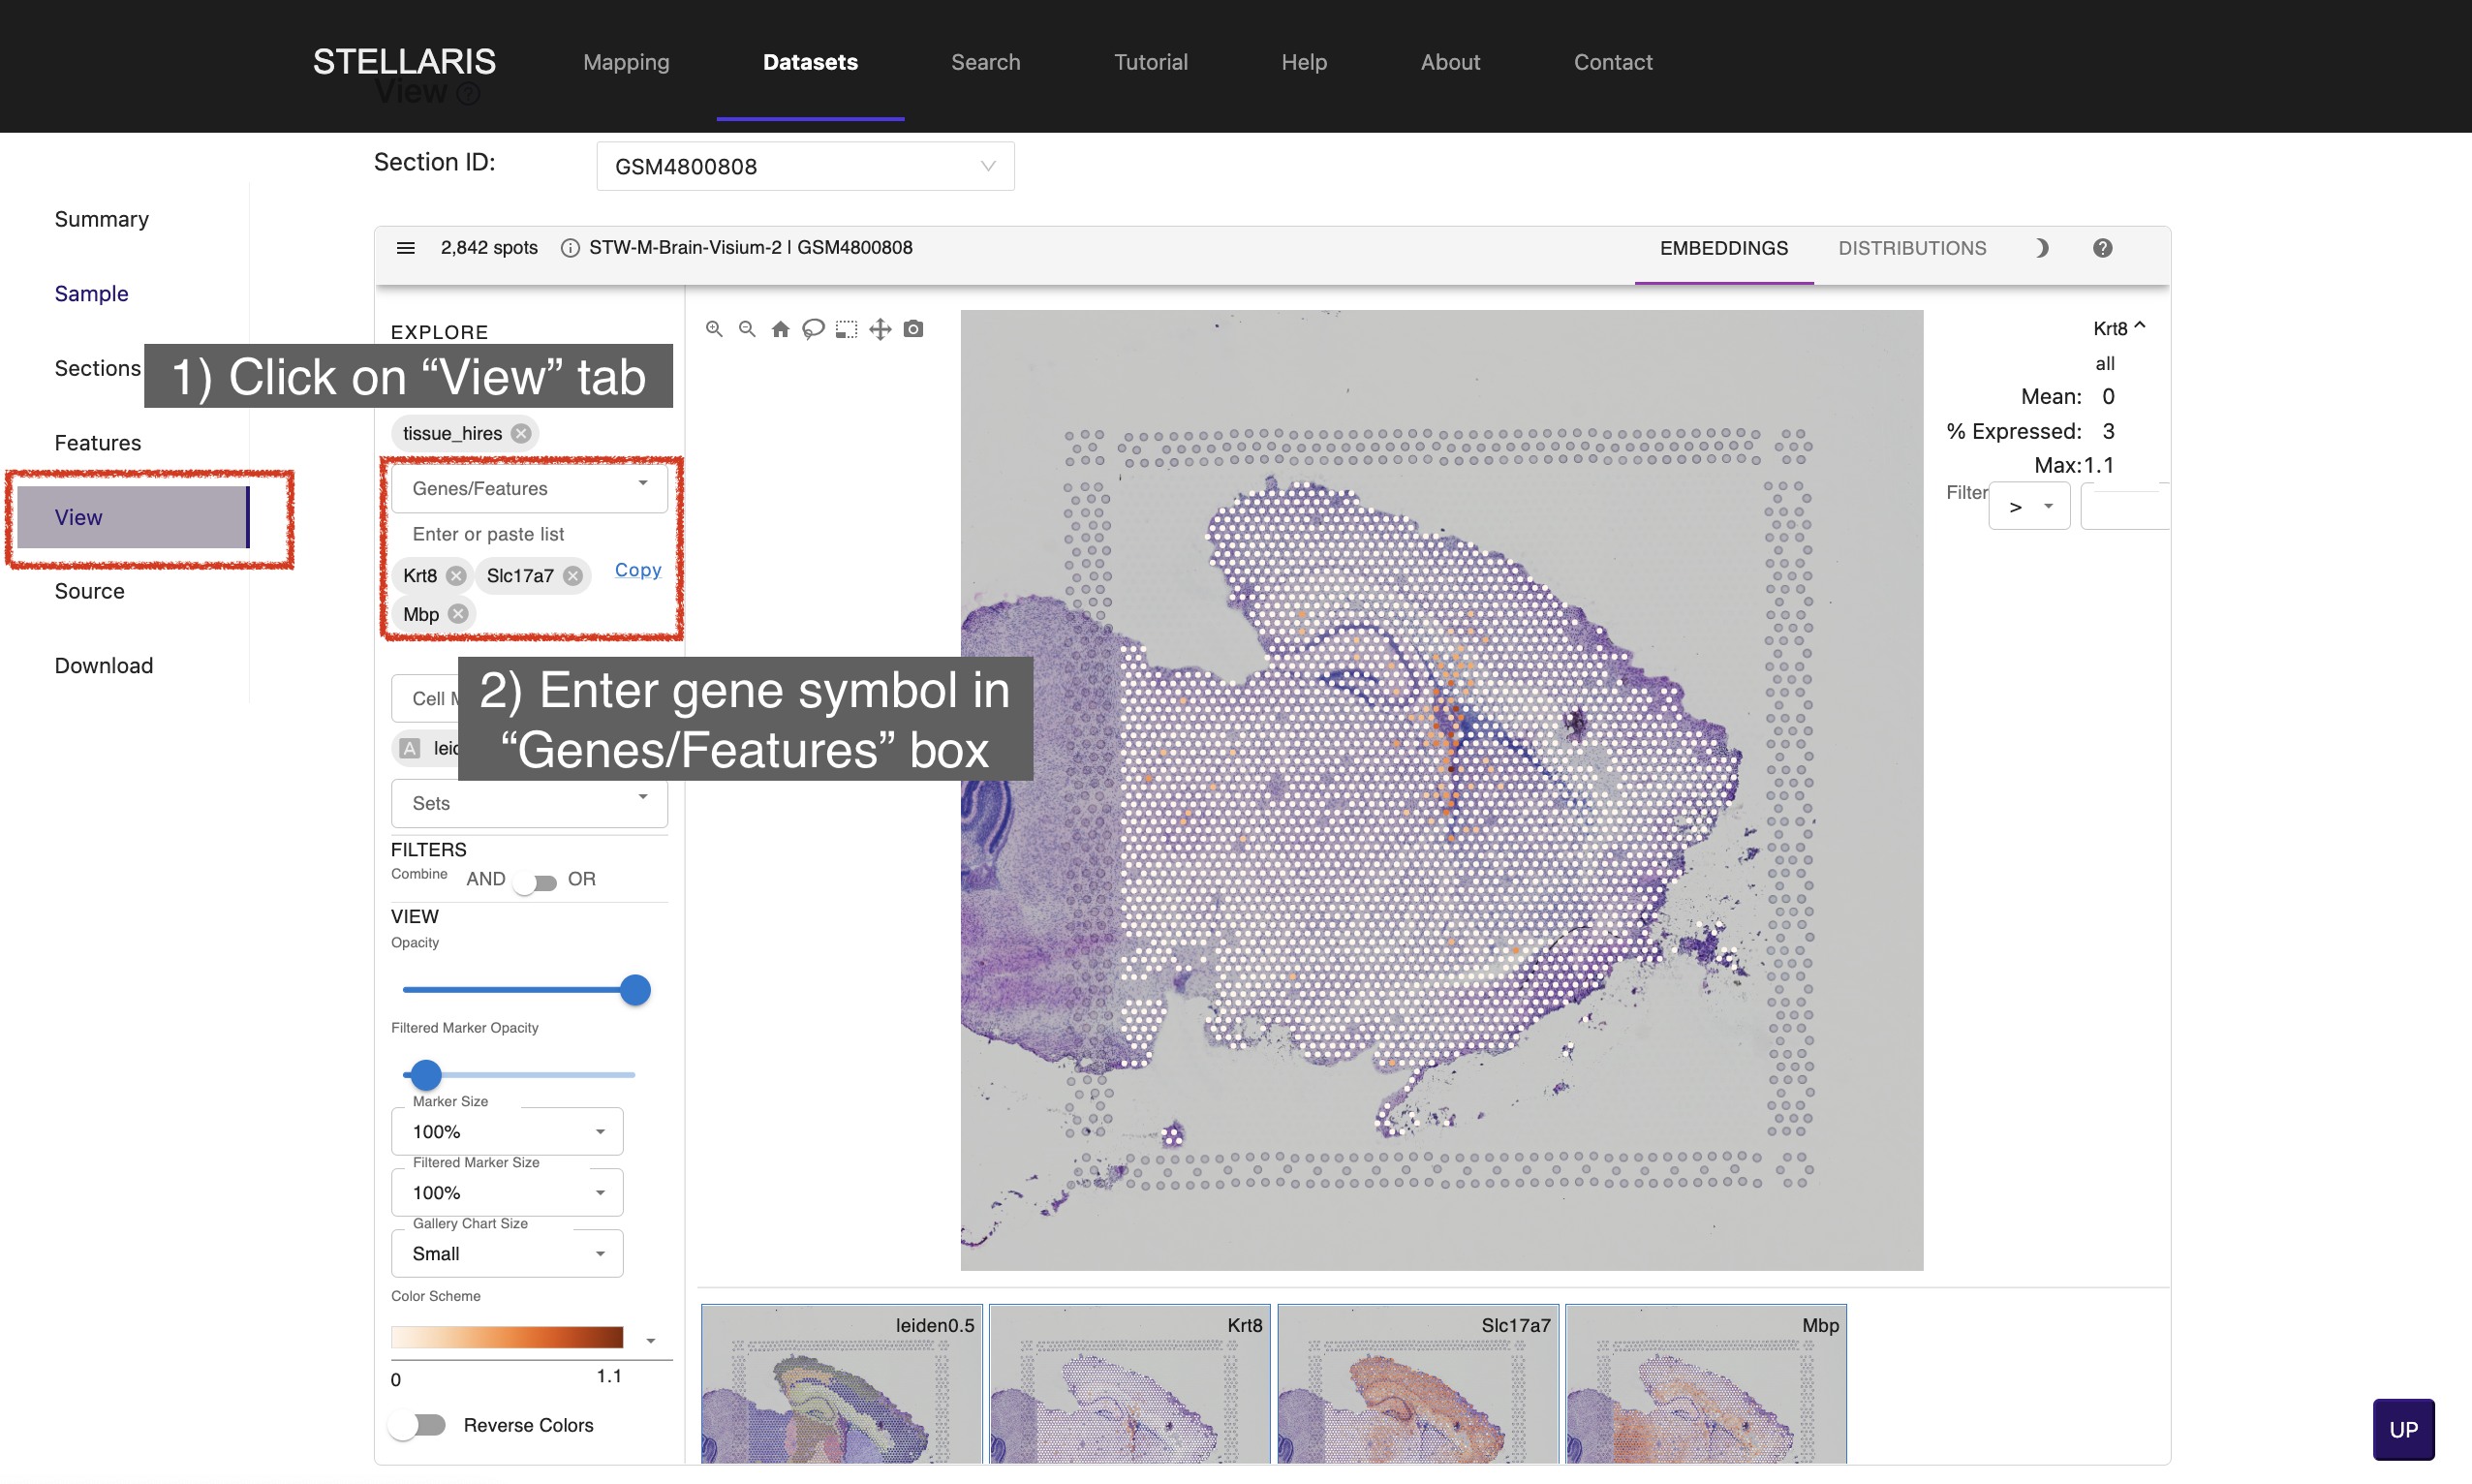
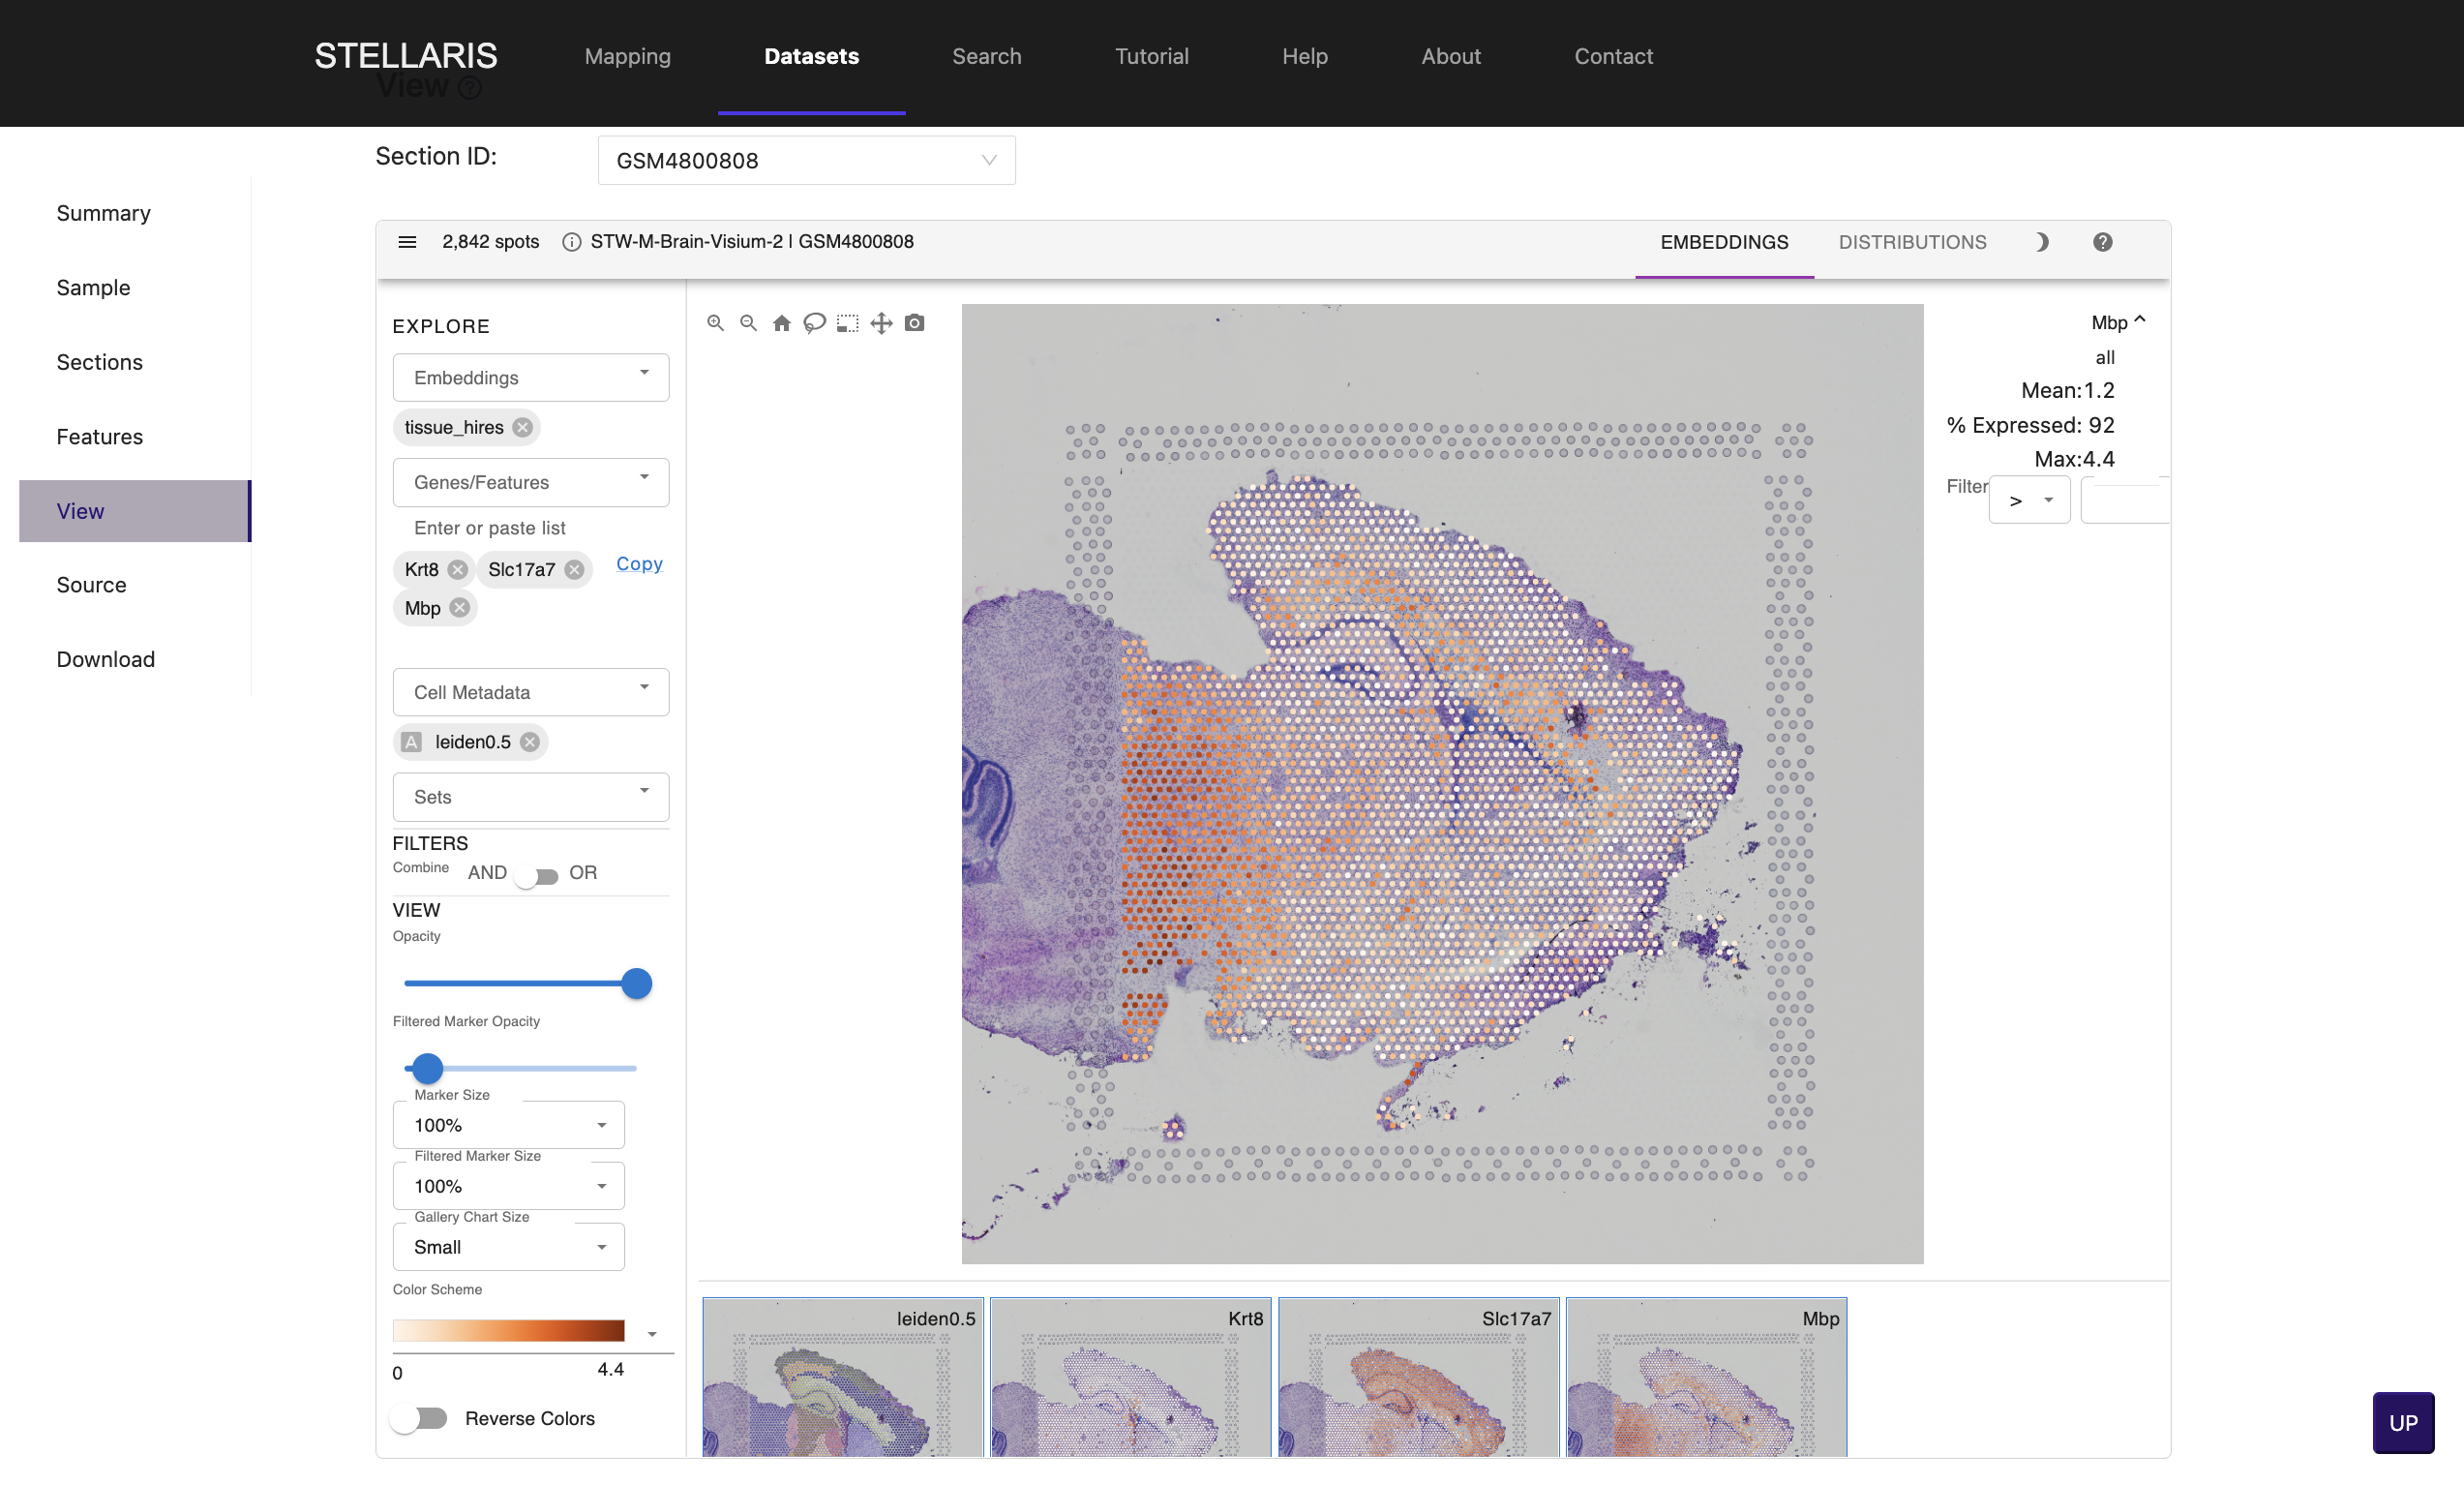
5. Click on "View" tab to explore the spatially resolved expression profiles of genes of interest. Enter gene symbol in "Genes/Features" box (e.g., Kr8, Slc17a7 and Mbp).
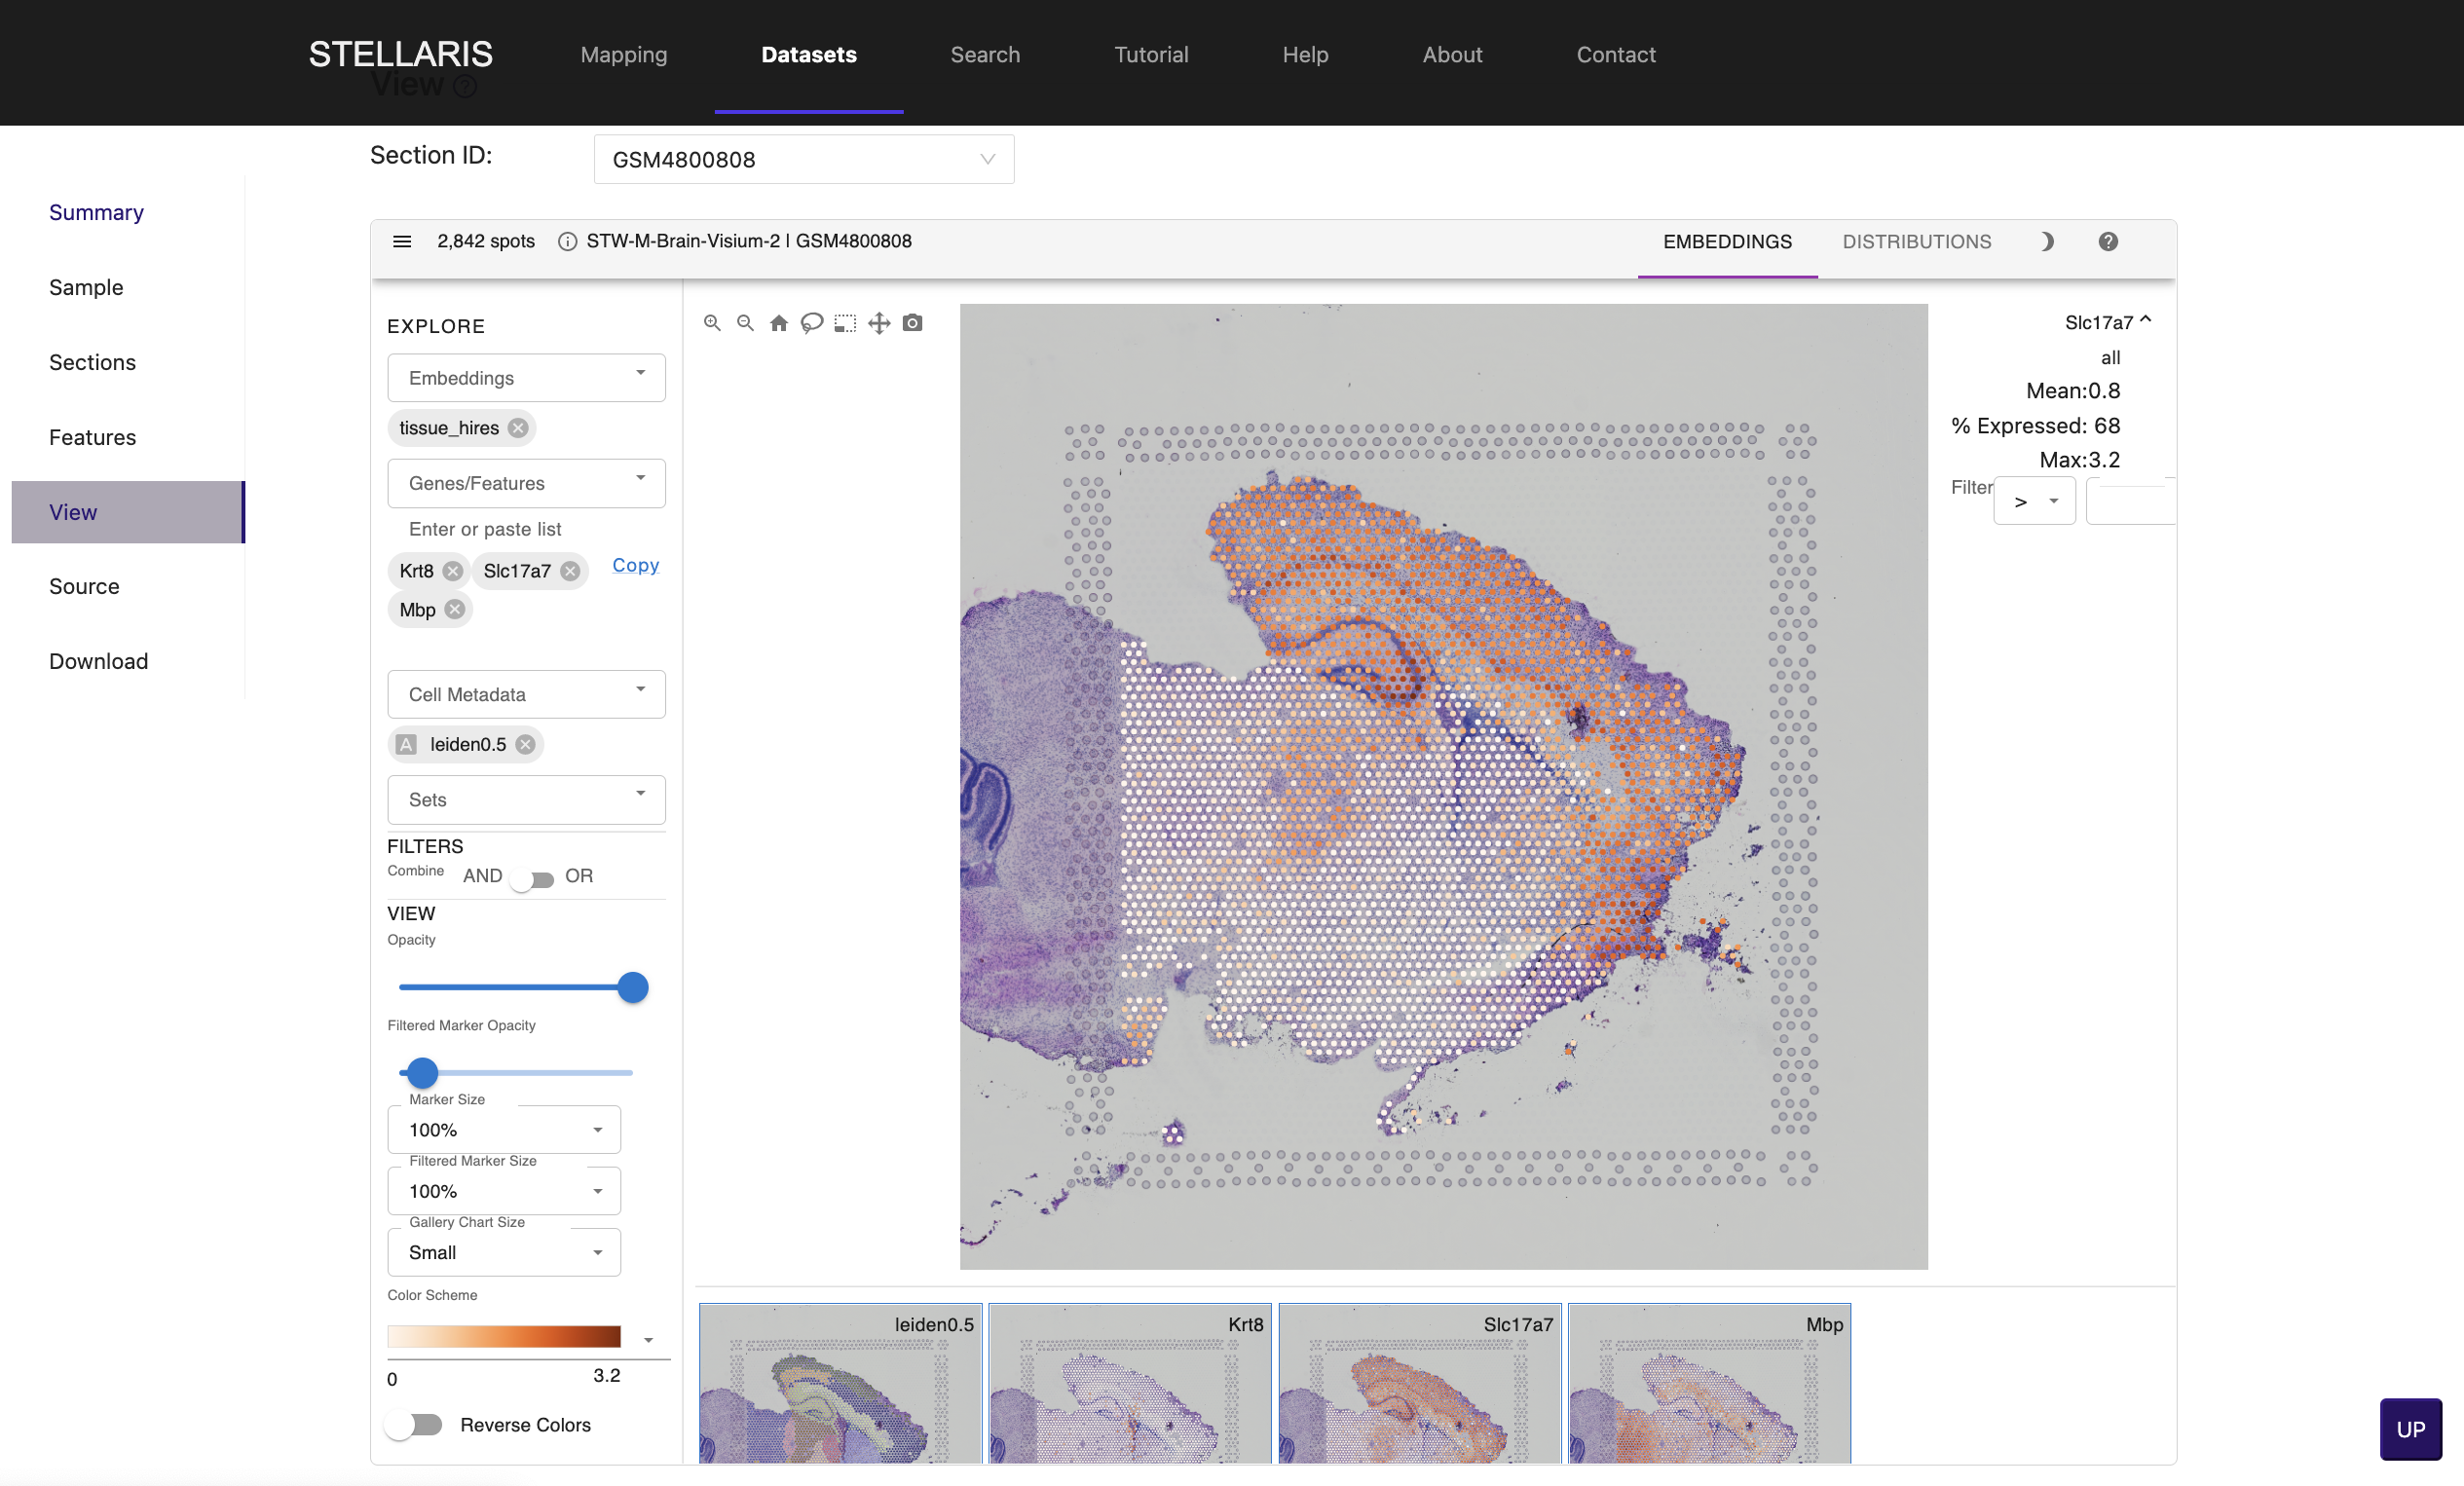
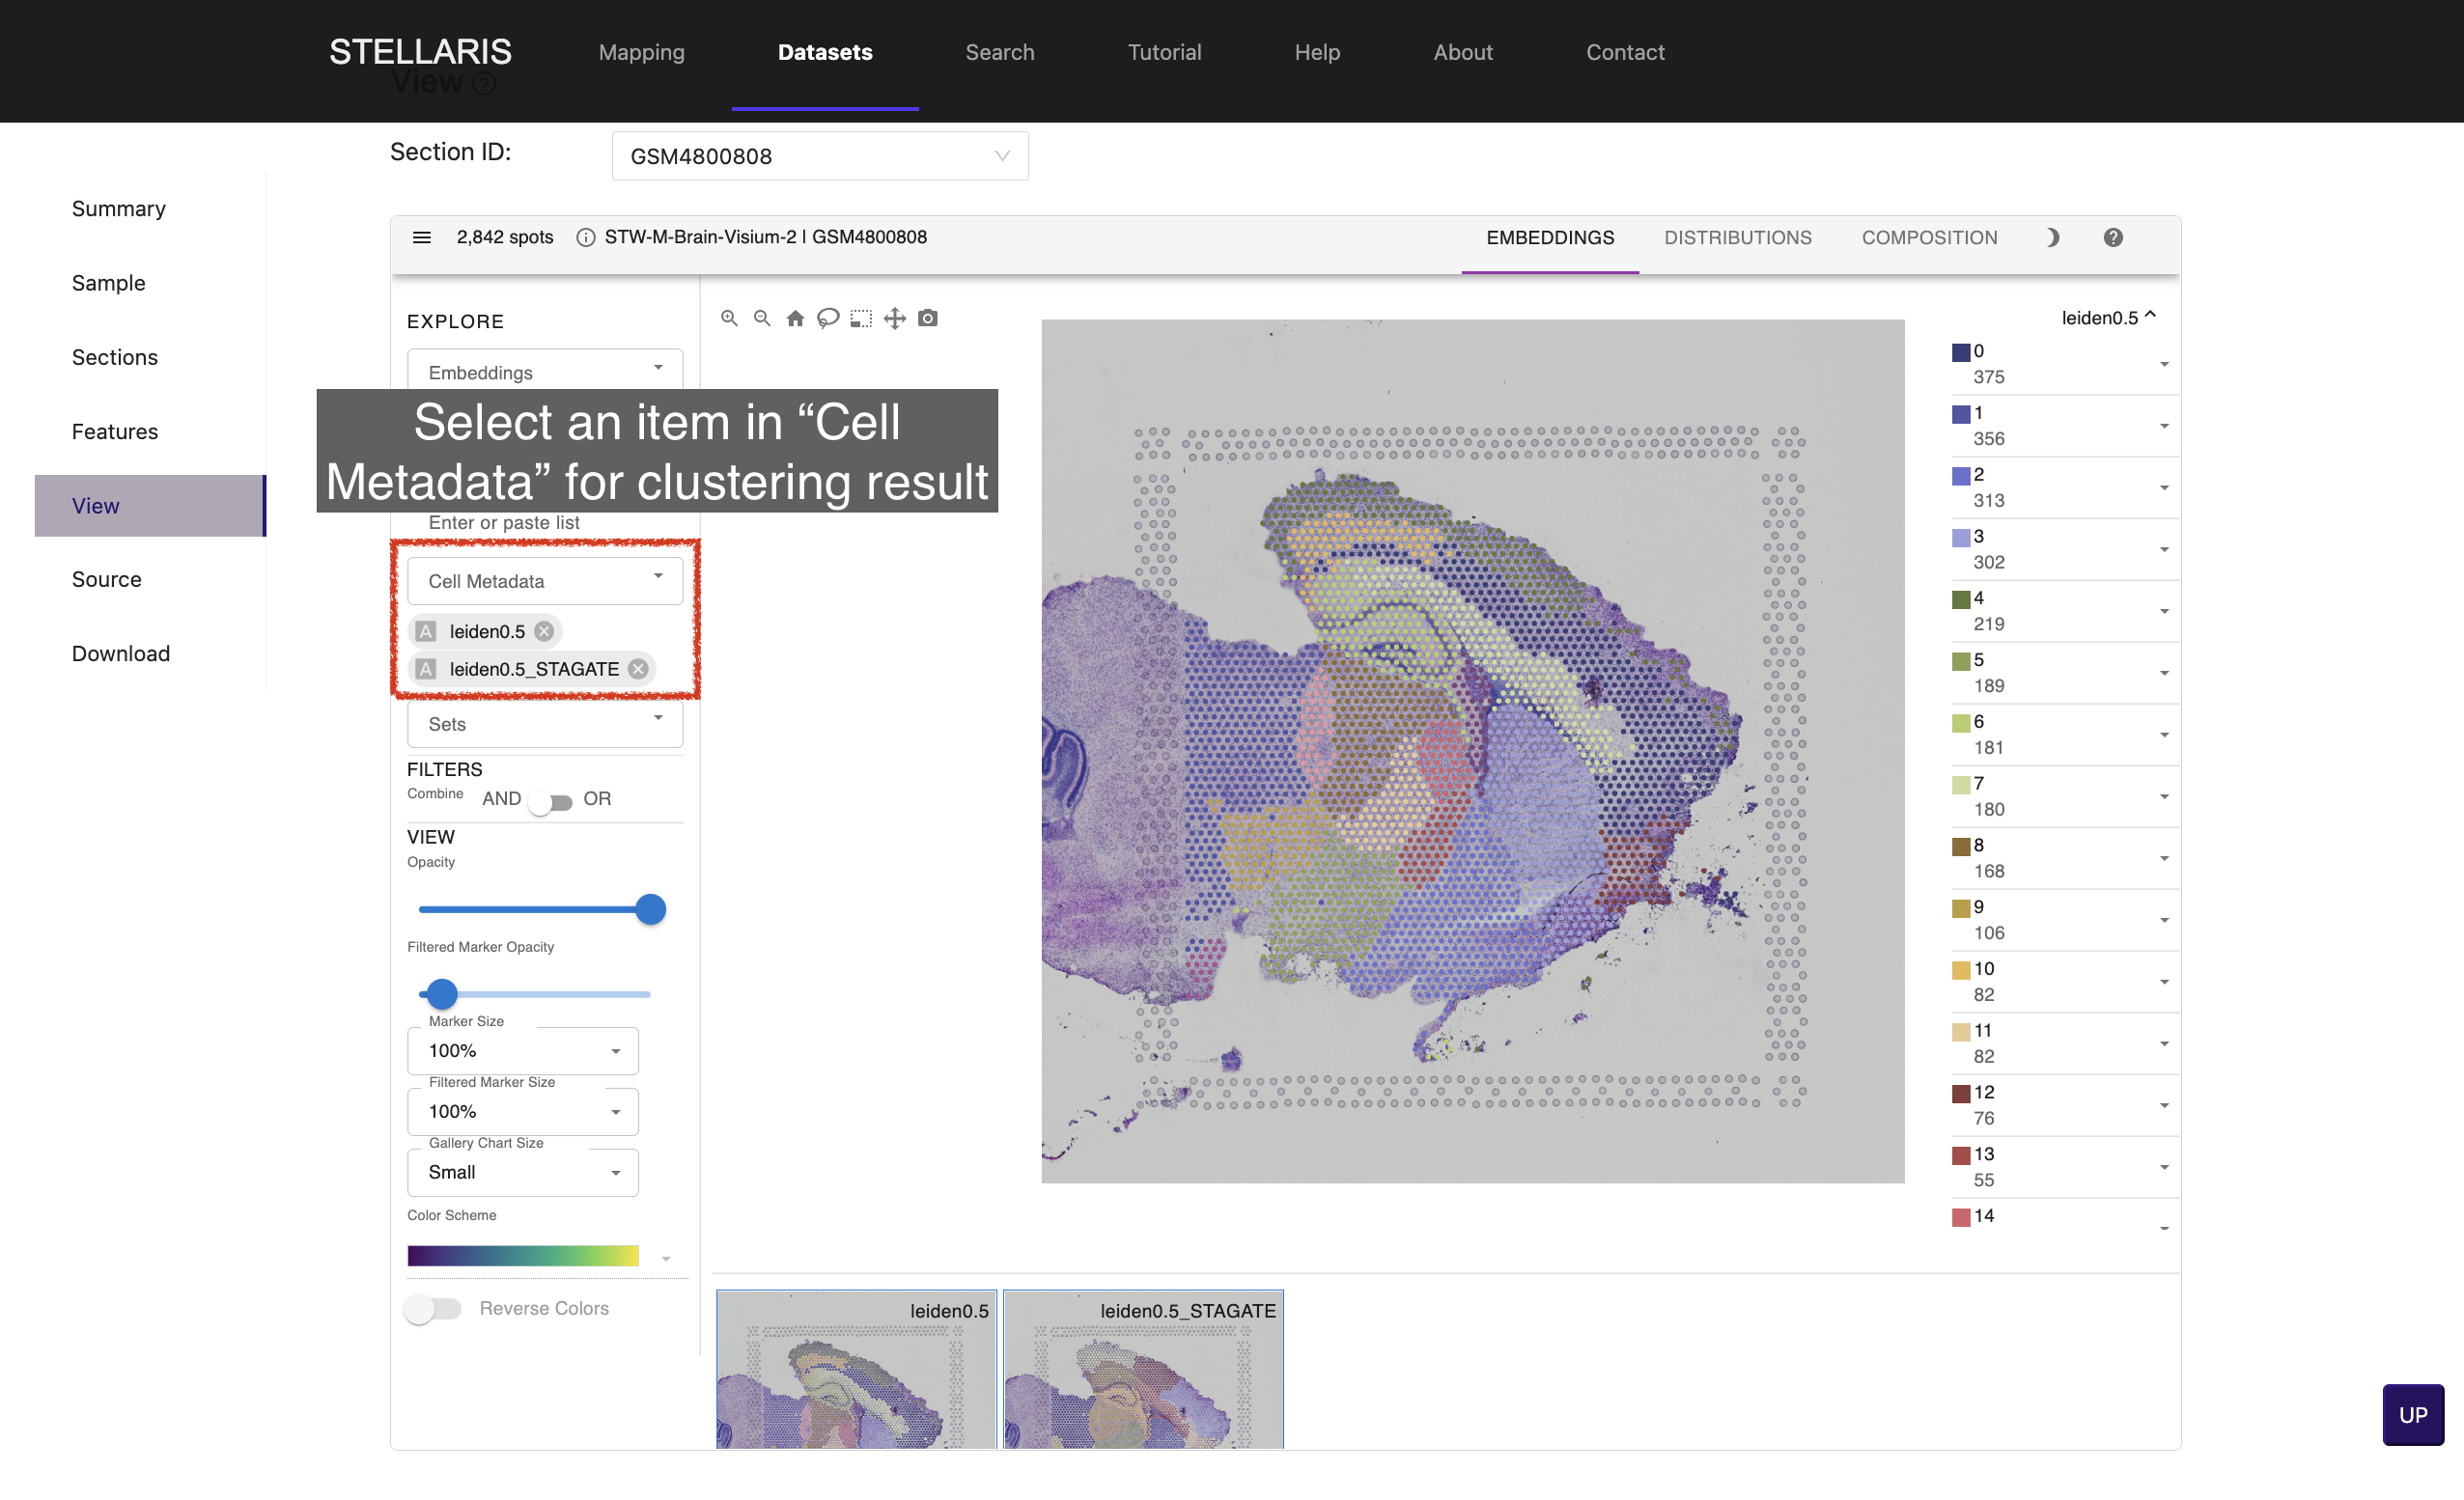
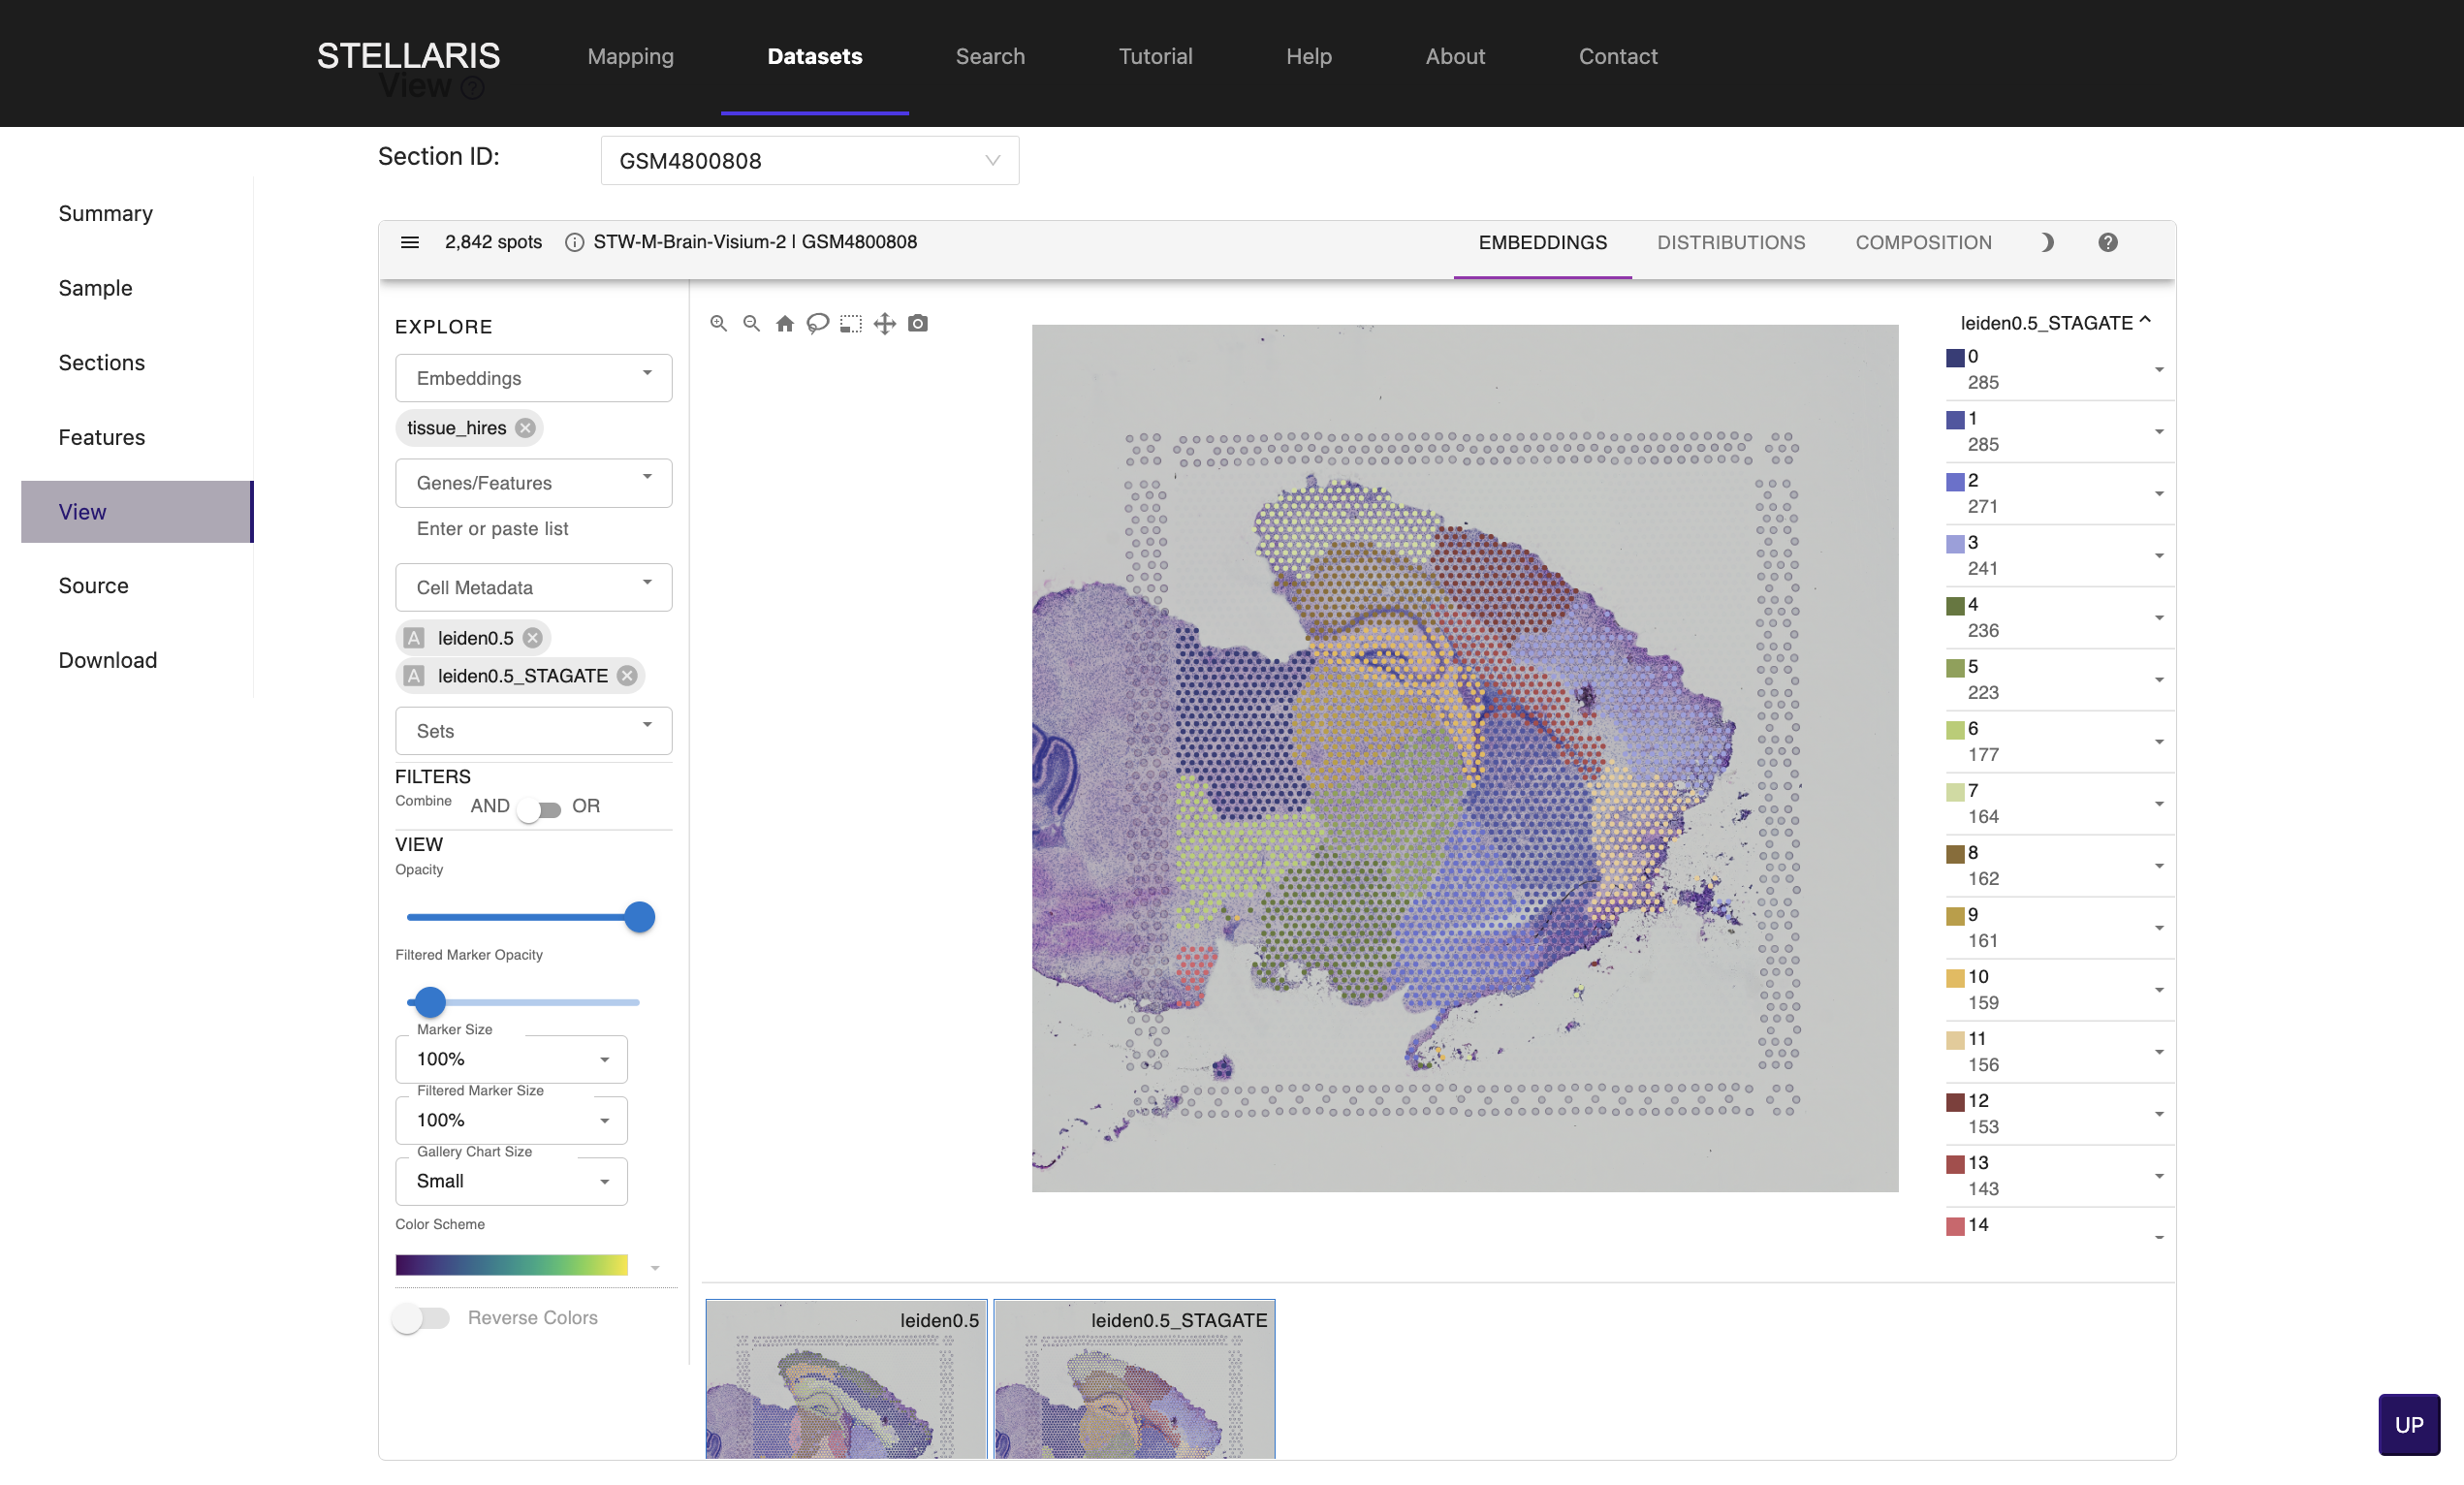
6.We have clustered spots into subgroups using traditional clustering (Leiden algorithm) and spatial clustering method (STAGATE) with multiple resolutions. Select an item in "Cell Metadata" drop-down box for clustering result (e.g., leiden0.5, leiden0.5_STAGATE).
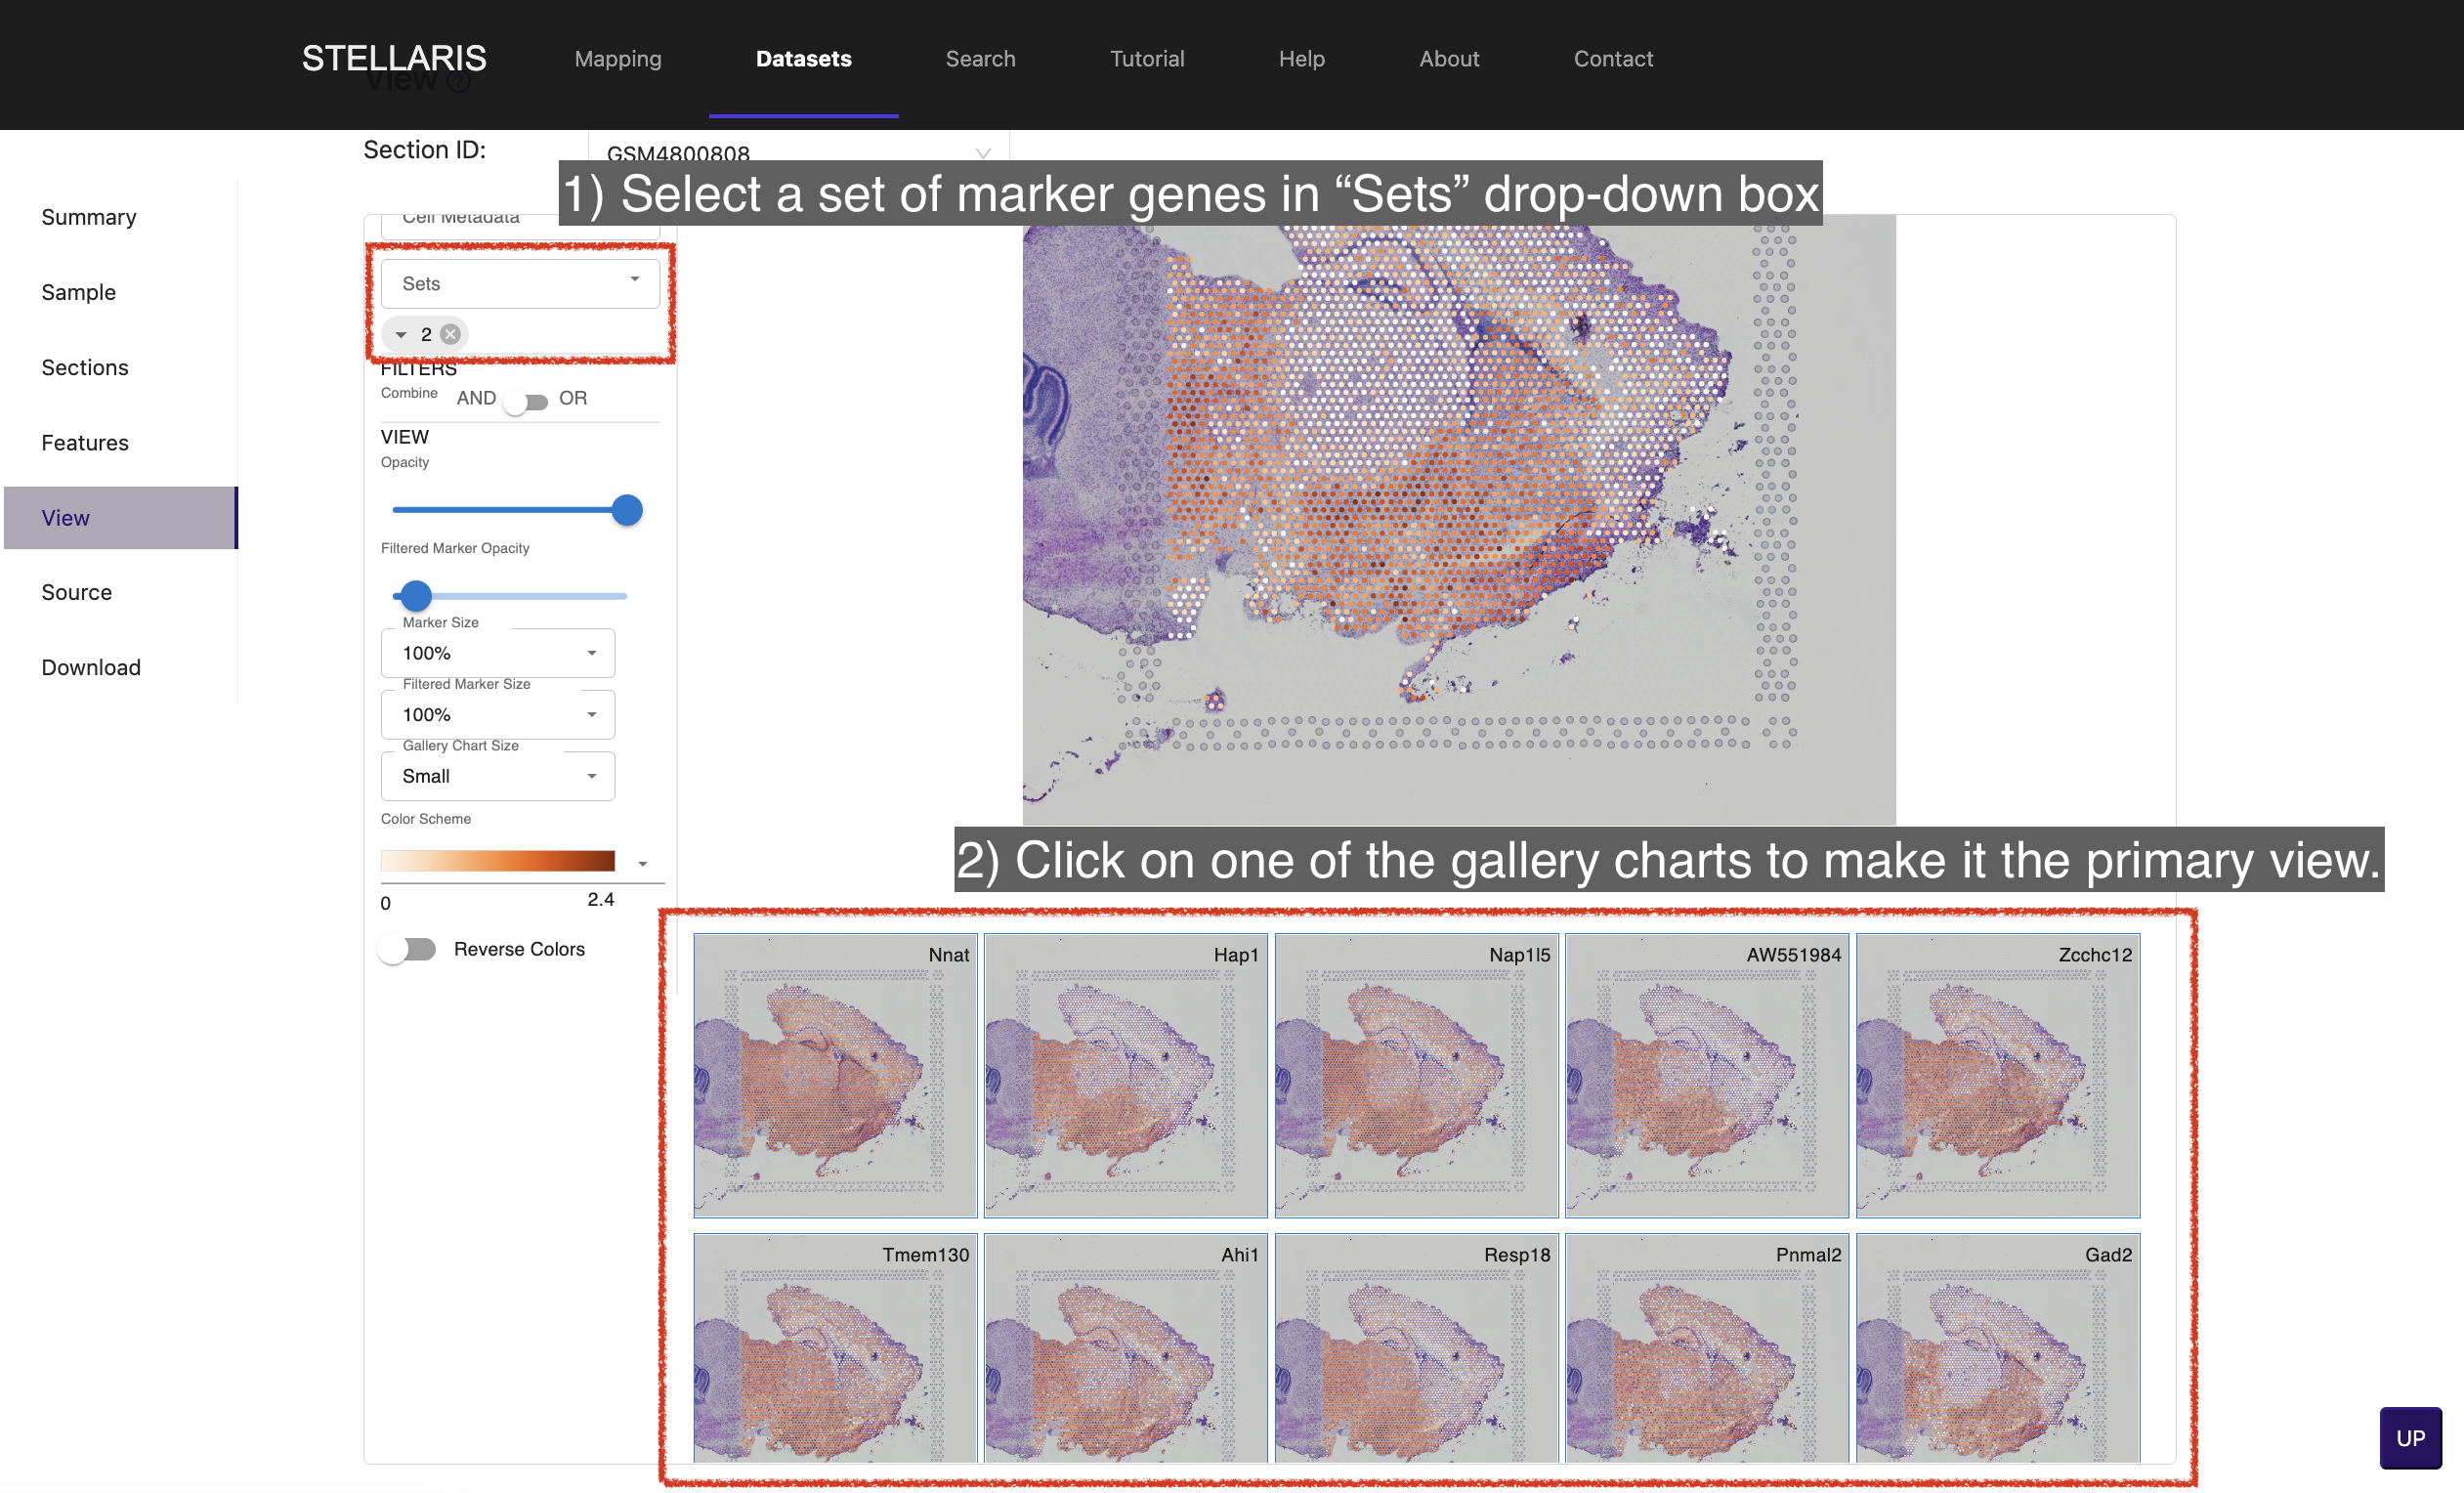
7. Select a set of marker genes in "Sets" drop-down box to view the gallery of maker gene expressions for a certain cluster. Click on one of the gallery charts to make it the primary view.
8. We provide the source of this ST dataset, along with the processed ST data in h5ad format (compatible with anndata python package) used to generate files for visualization shown above, which is ready to download.
