Result interpretation - Mouse fetal brain
We continue by explaining how to parse the spatial mapping results after getting started. The result page for this case study (mouse fetal brain) is available at 52fa0100-909b-11ed-9249-979b422f6c75 . You can also access it from the home page.
Before interpreting the results, we will explain the computational method used for spatial mapping. We adopted a metric learning approach that used a multivariate random forest (RF) model, as previously described in CellTrek (https://doi.org/10.1038/s41587-022-01233-1). ). Briefly, this method trains a multivariate RF model on ST data in the shared latent space and then applies the model to the coembedding data of the scRNA-seq data and the ST data, thereby enabling the prediction of spatial coordinates of single cells by assigning them to the reciprocal nearest ST spots, where the similarity is measured by the RF distance metric. Further details are available here .
To attenuate the confounding effects caused by the incompatibility between the two modalities, we implement a filtering method called coembedding filtering before the spatial mapping step.
Once the job is finished, a result page will be available, providing a systematic summary of the mapping results regarding filtering, evaluation of the mapping quality and the consequent landscape of intercellular communications in the spatial context. The page consists of five sections, including preprocessing, coembedding filtering, spatial cellular map, cell type colocalization and cell-cell ligand-receptor interactions (LRIs). Now, we will go through this page for result interpretation.
1. Preprocessing
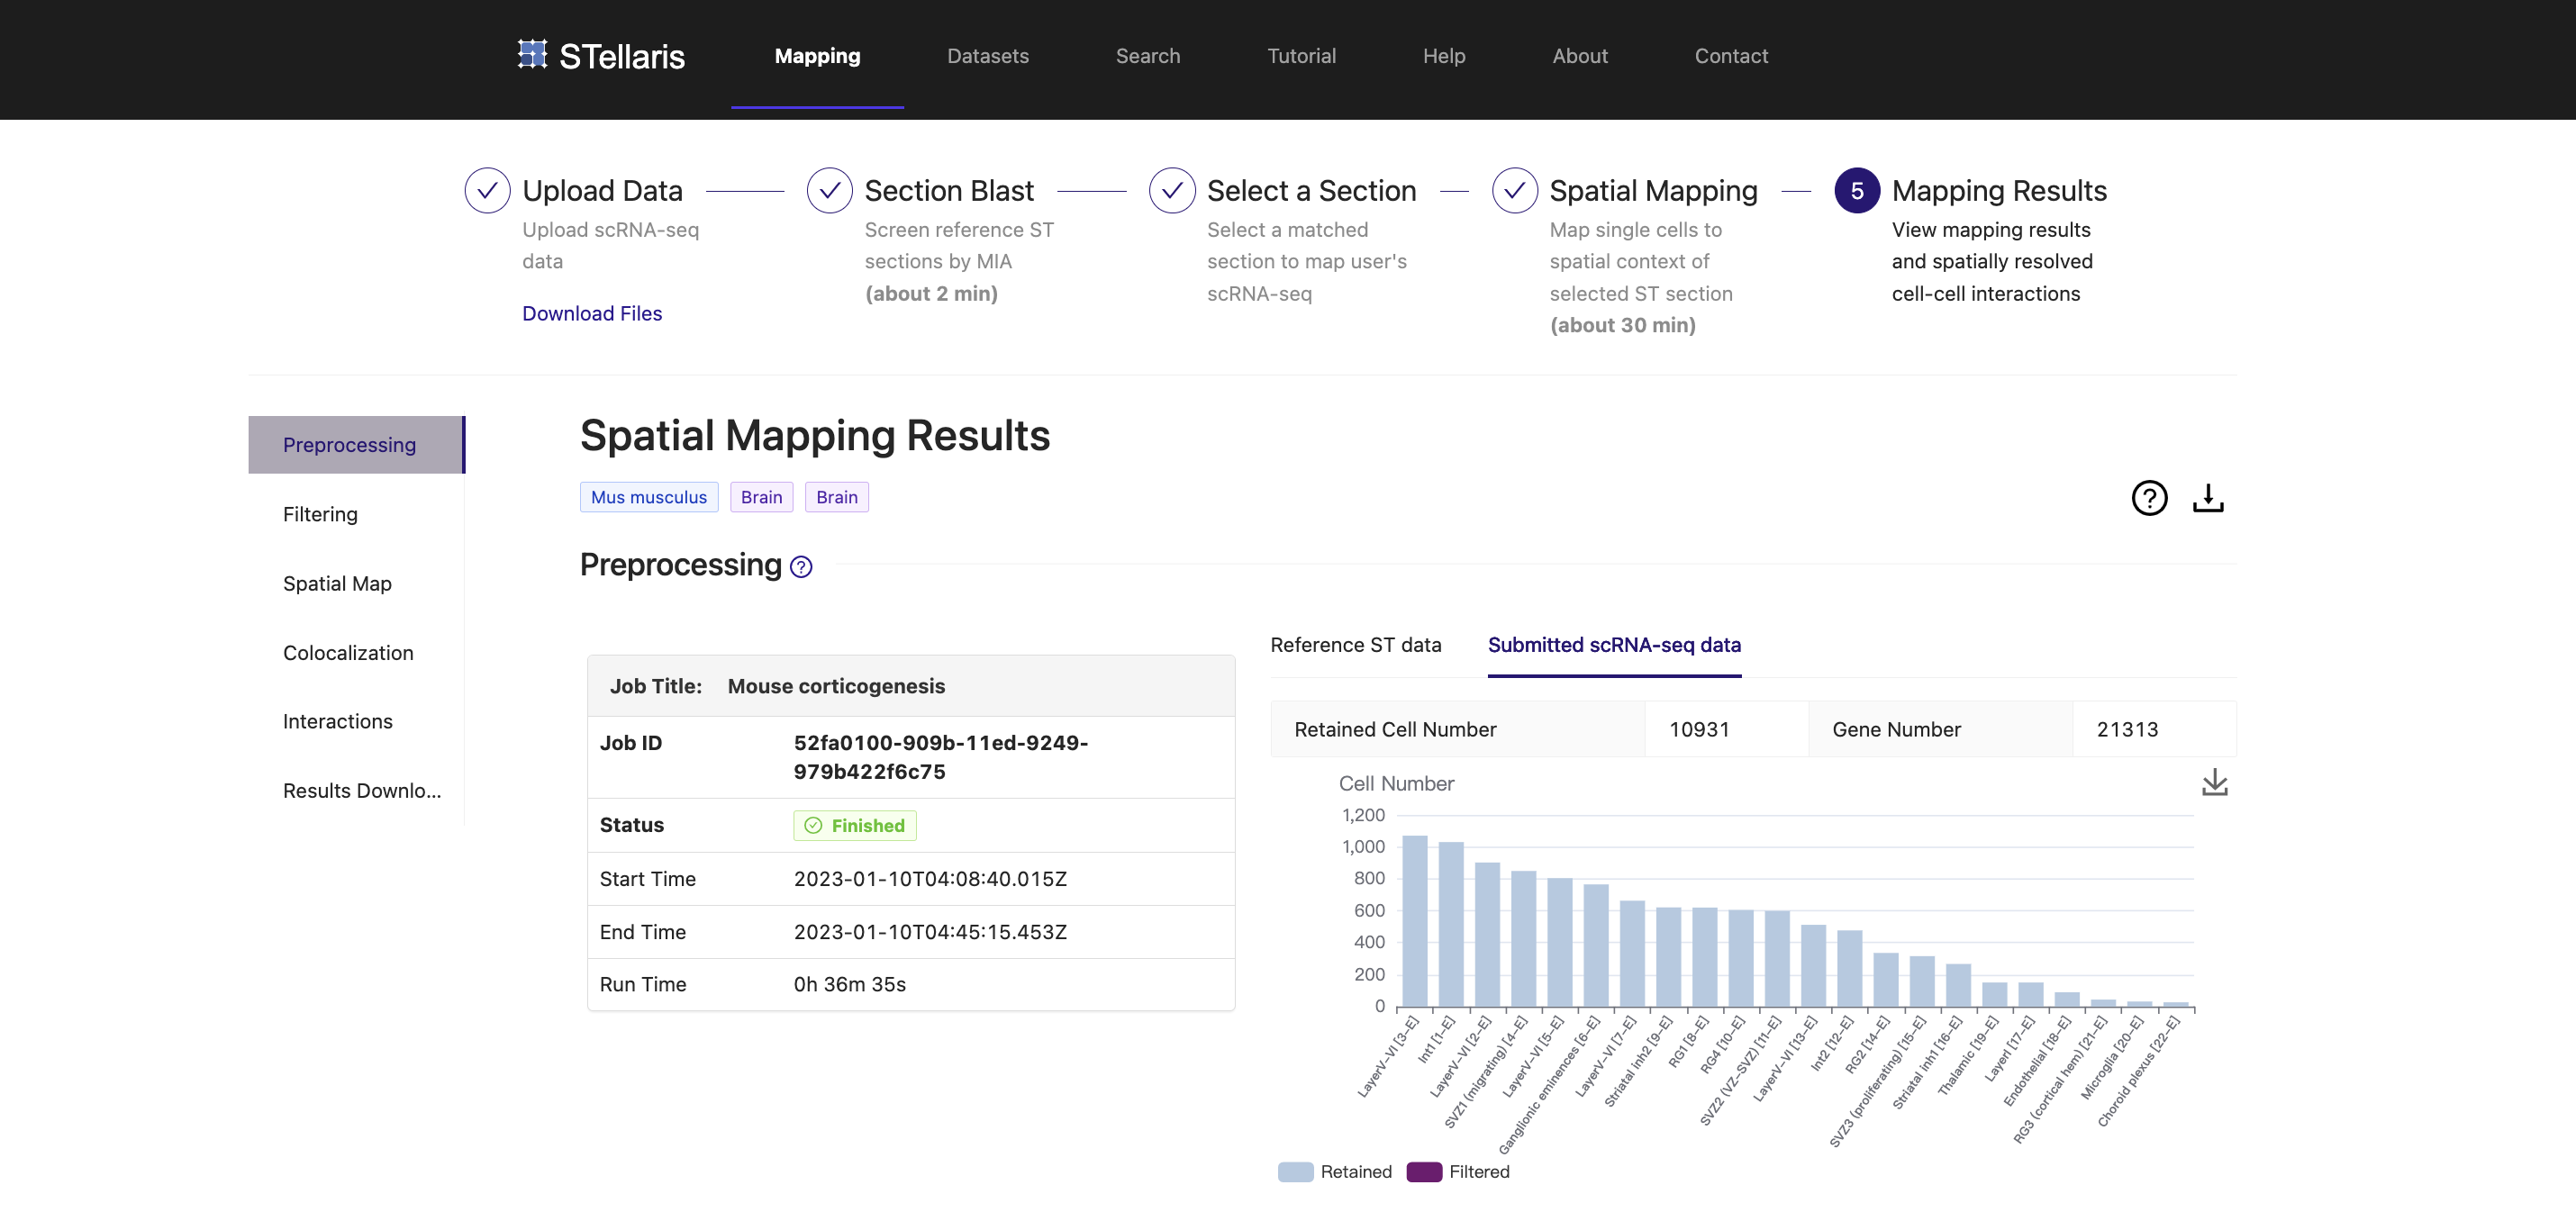
Prior to spatial mapping, low-quality cells (genes detected <200 or mitochondrial proportion >20%) were excluded. This section displays the elapsed time for the execution of spatial mapping (left) and the basic information of query scRNA-seq data and the selected ST section (right). The stacked bar plot visualizes the number of cells that are filtered off and retained, and the summary of the retained cells and genes is shown on the top.
2. Coembedding filtering
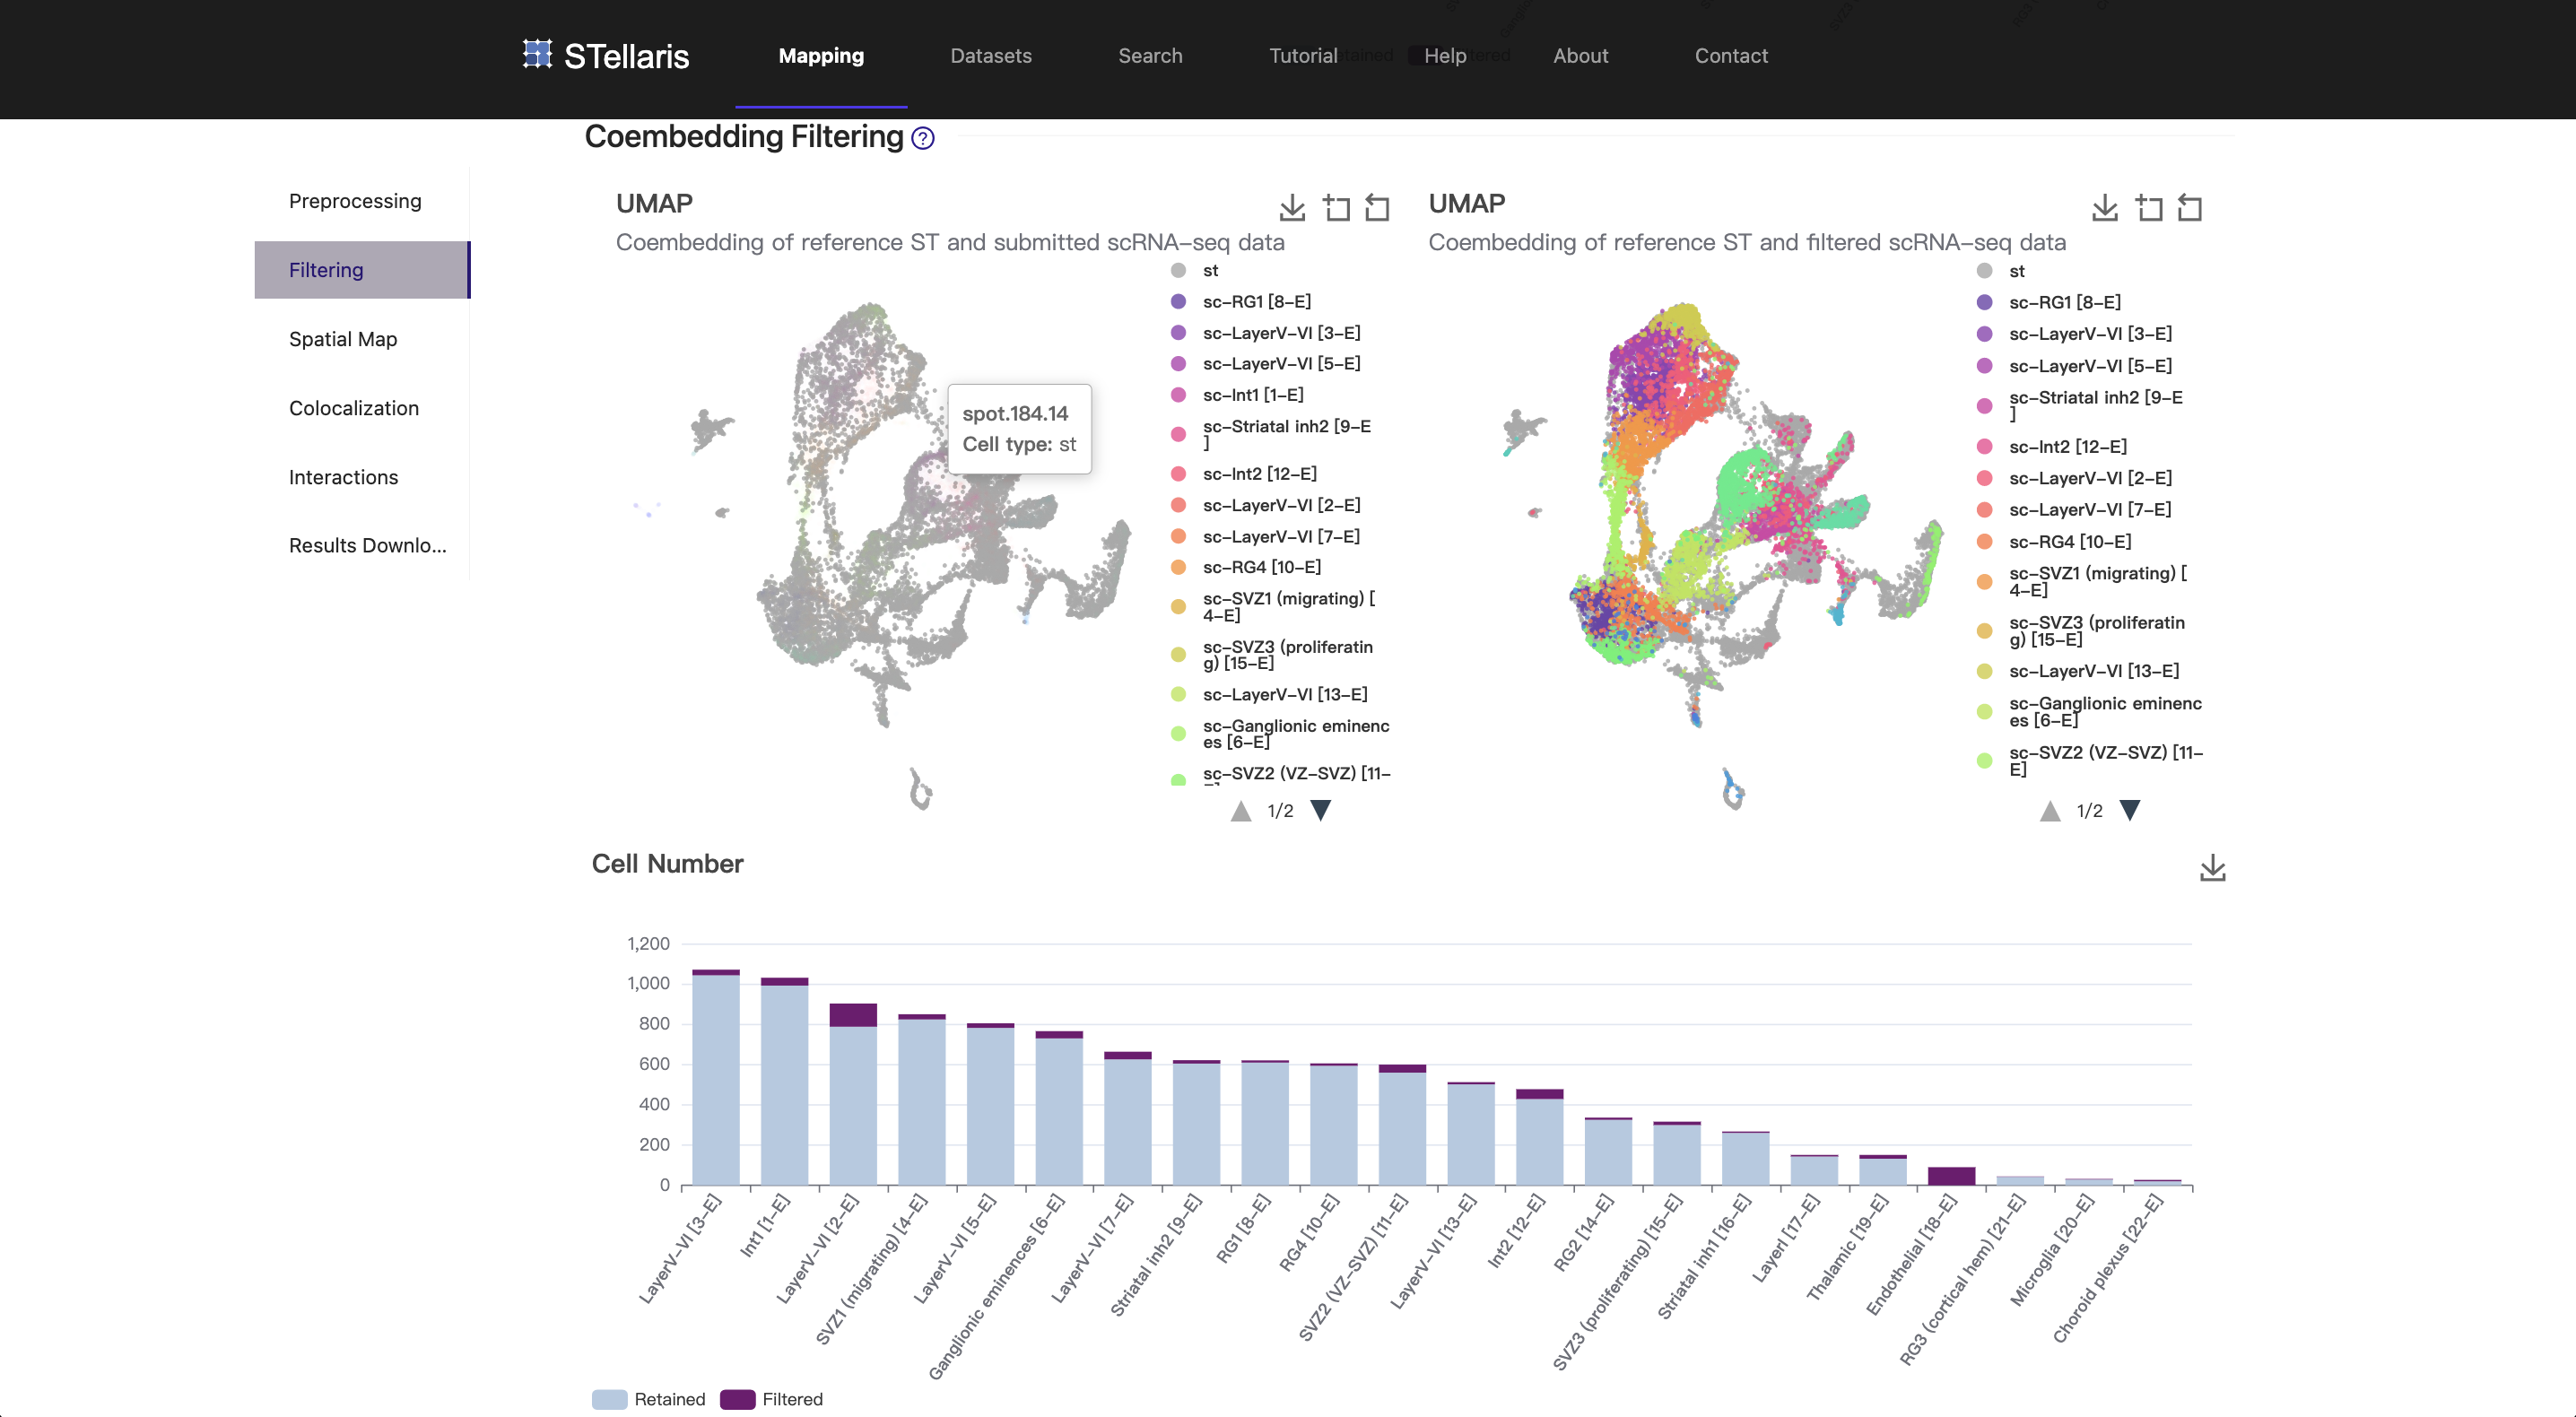
As previously mentioned, the scRNA-seq data and the ST data were first projected into a joint latent space. Intuitively, a cell is safely assigned to a ST spot and thereby acquires a coordinate if they are close to each other, and vice versa. However, Celltrek could greedily assign single cells to ST spots even if they were derived from completely different tissues. In our tests, over 80% of cells from the mouse liver could be successfully mapped to the ST section from the mouse brain that we are currently using, although they were not well integrated. We implemented a compromised approach by filtering cells that were not well mixed with ST spots in shared latent space, thus attenuating the confounding effects caused by the incompatibility between these two modalities.
The joint embeddings of single cells and ST spots can be visualized by Uniform Manifold Approximation and Projection (UMAP) plots. The original embedding result is shown in the upper left, and the filtered result is shown in the upper right. In this case, the scRNA-seq data and the ST data were properly aligned as they were obtained from the same developmental stage. As a result, only a few cells were filtered out in this step. Only the retained cells will be considered in the subsequent mapping analysis.
3. Spatial cellular map
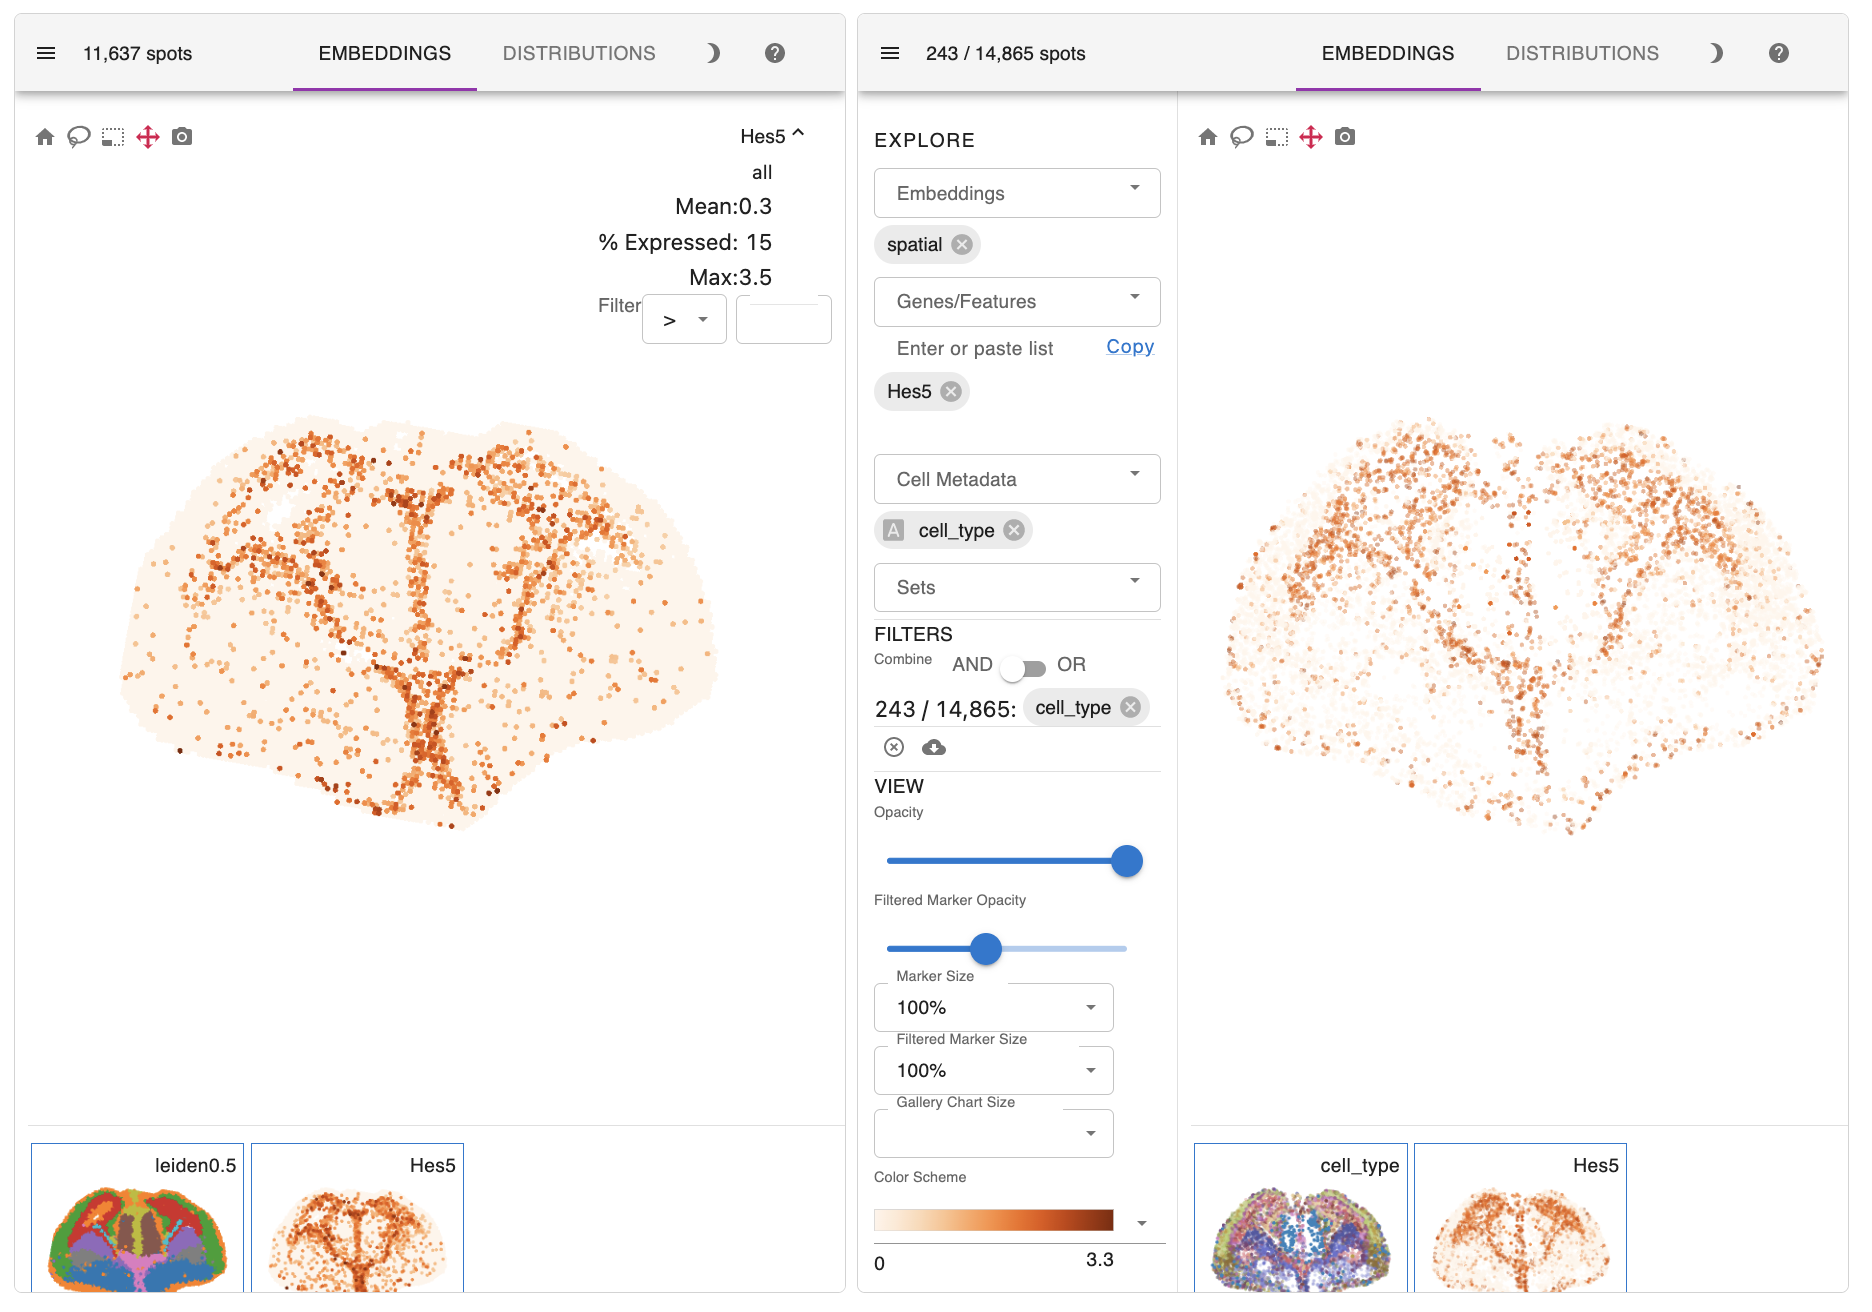
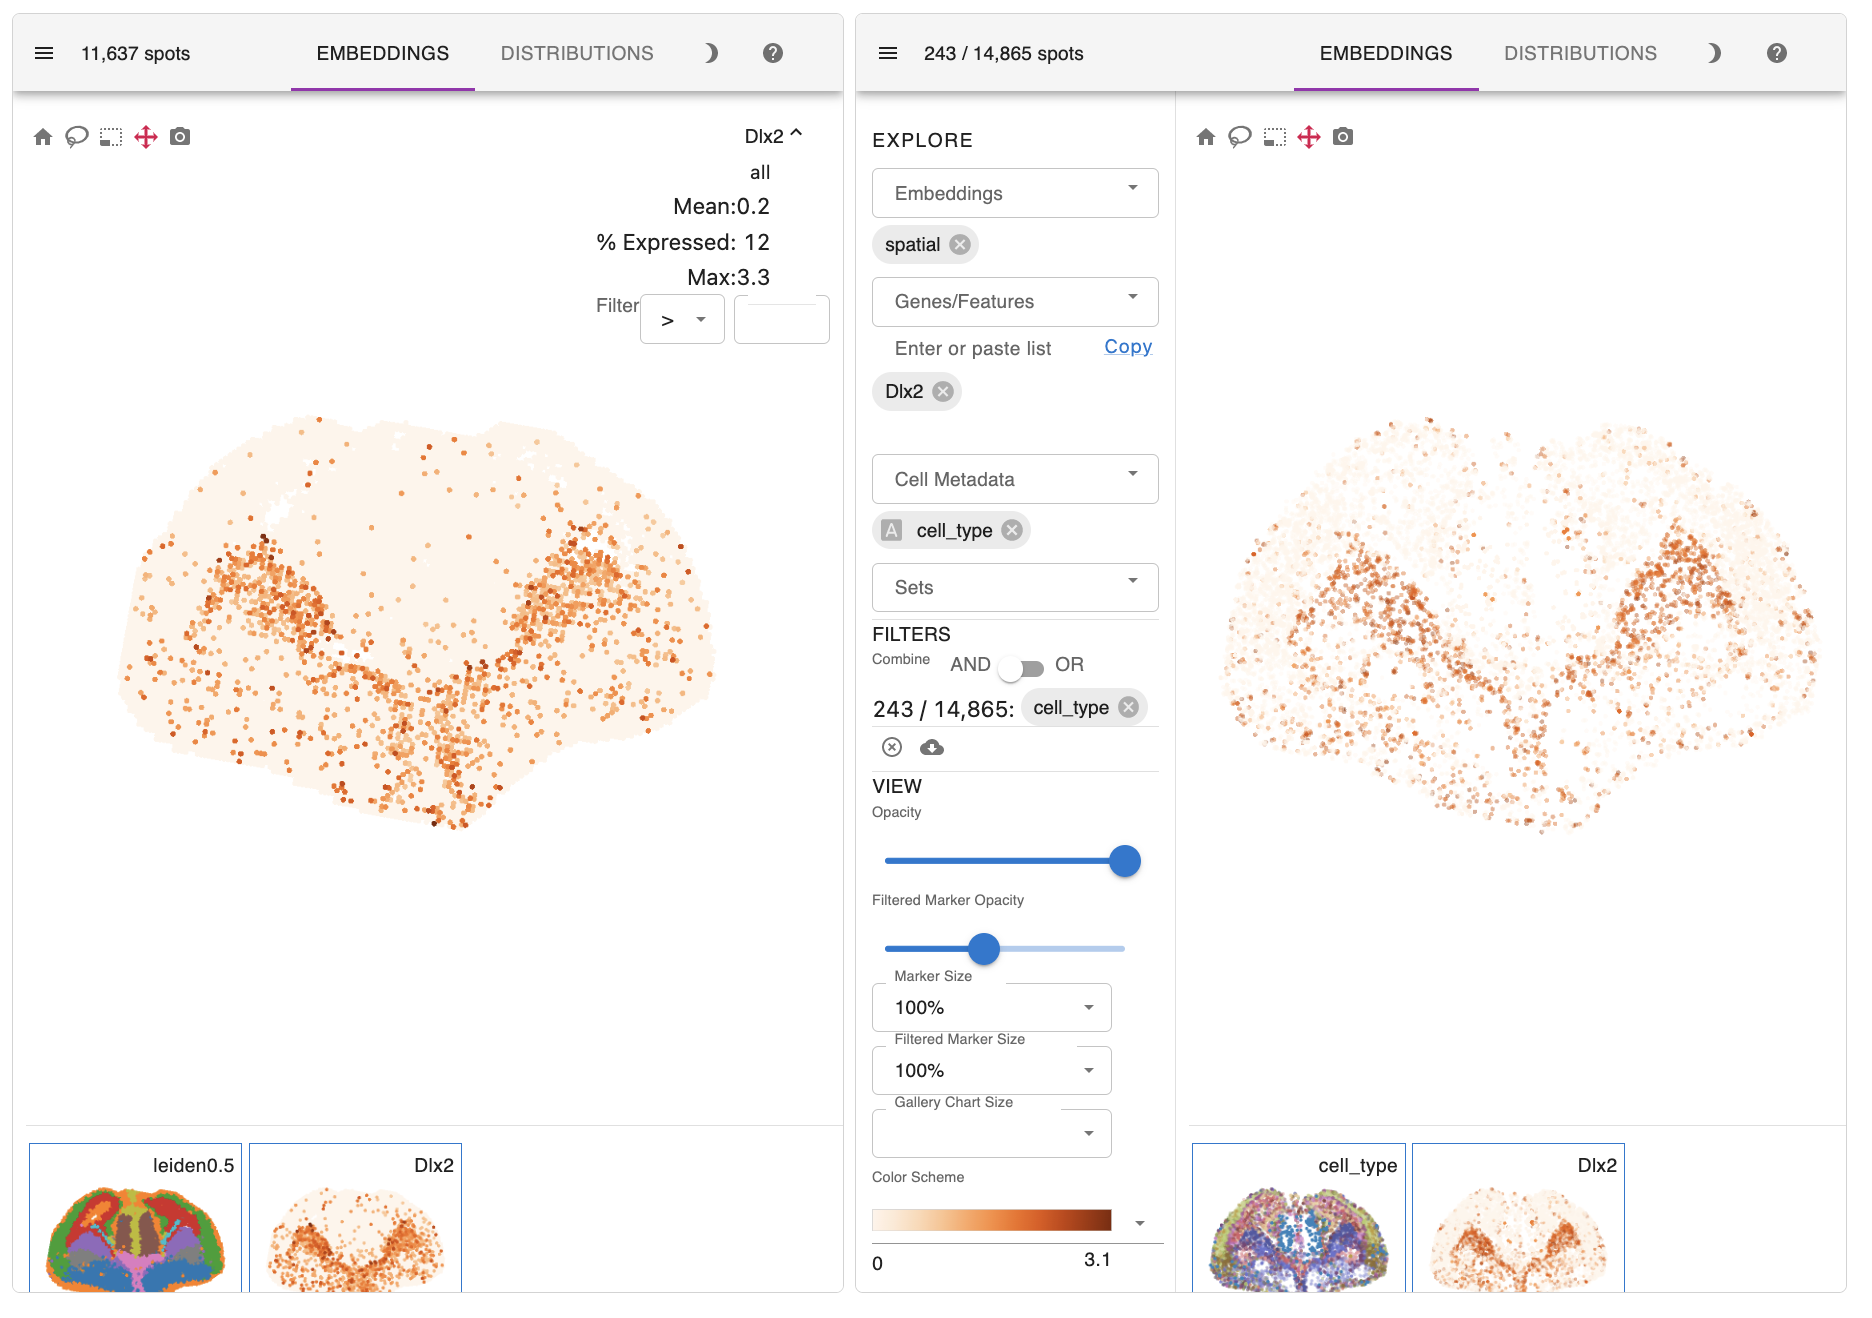
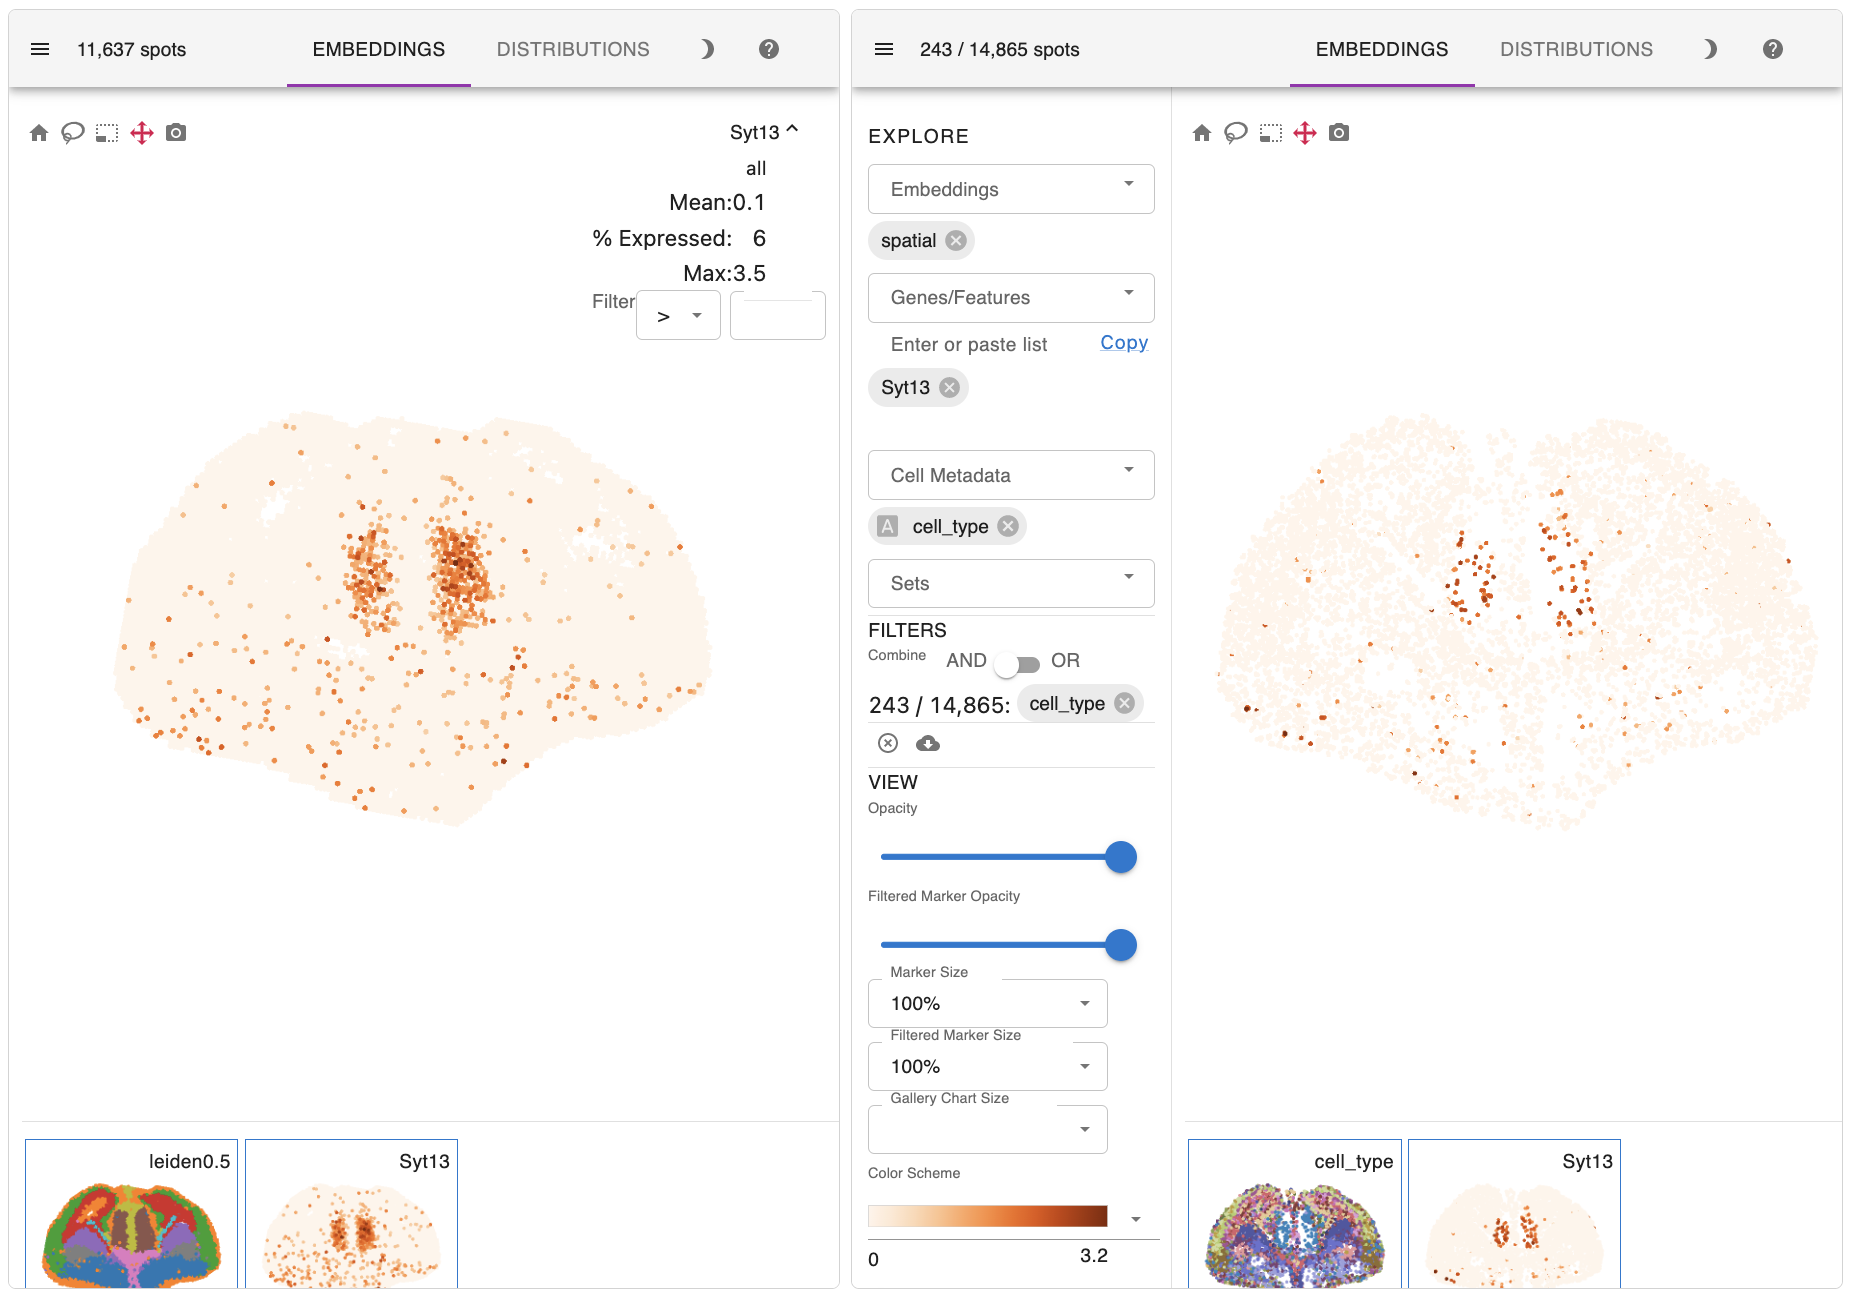
Here are the key results of the spatial mapping step. The original spatial transcriptomic map of the selected ST section is displayed in the upper left, along with the spatial mapping result of single cells at a single-cell resolution in the upper right. This interactive panel allows you to view the spatial distribution of your desired cell type on the right tab. You can also search for the spatial expression patterns of genes of interest.
The bar plot in the lower left summarizes the mapping results for each cell type. The histogram in the lower right provides an intuitive assessment of mapping quality. A summit of RF distance around 0.5 or even lower indicates an acceptable result.
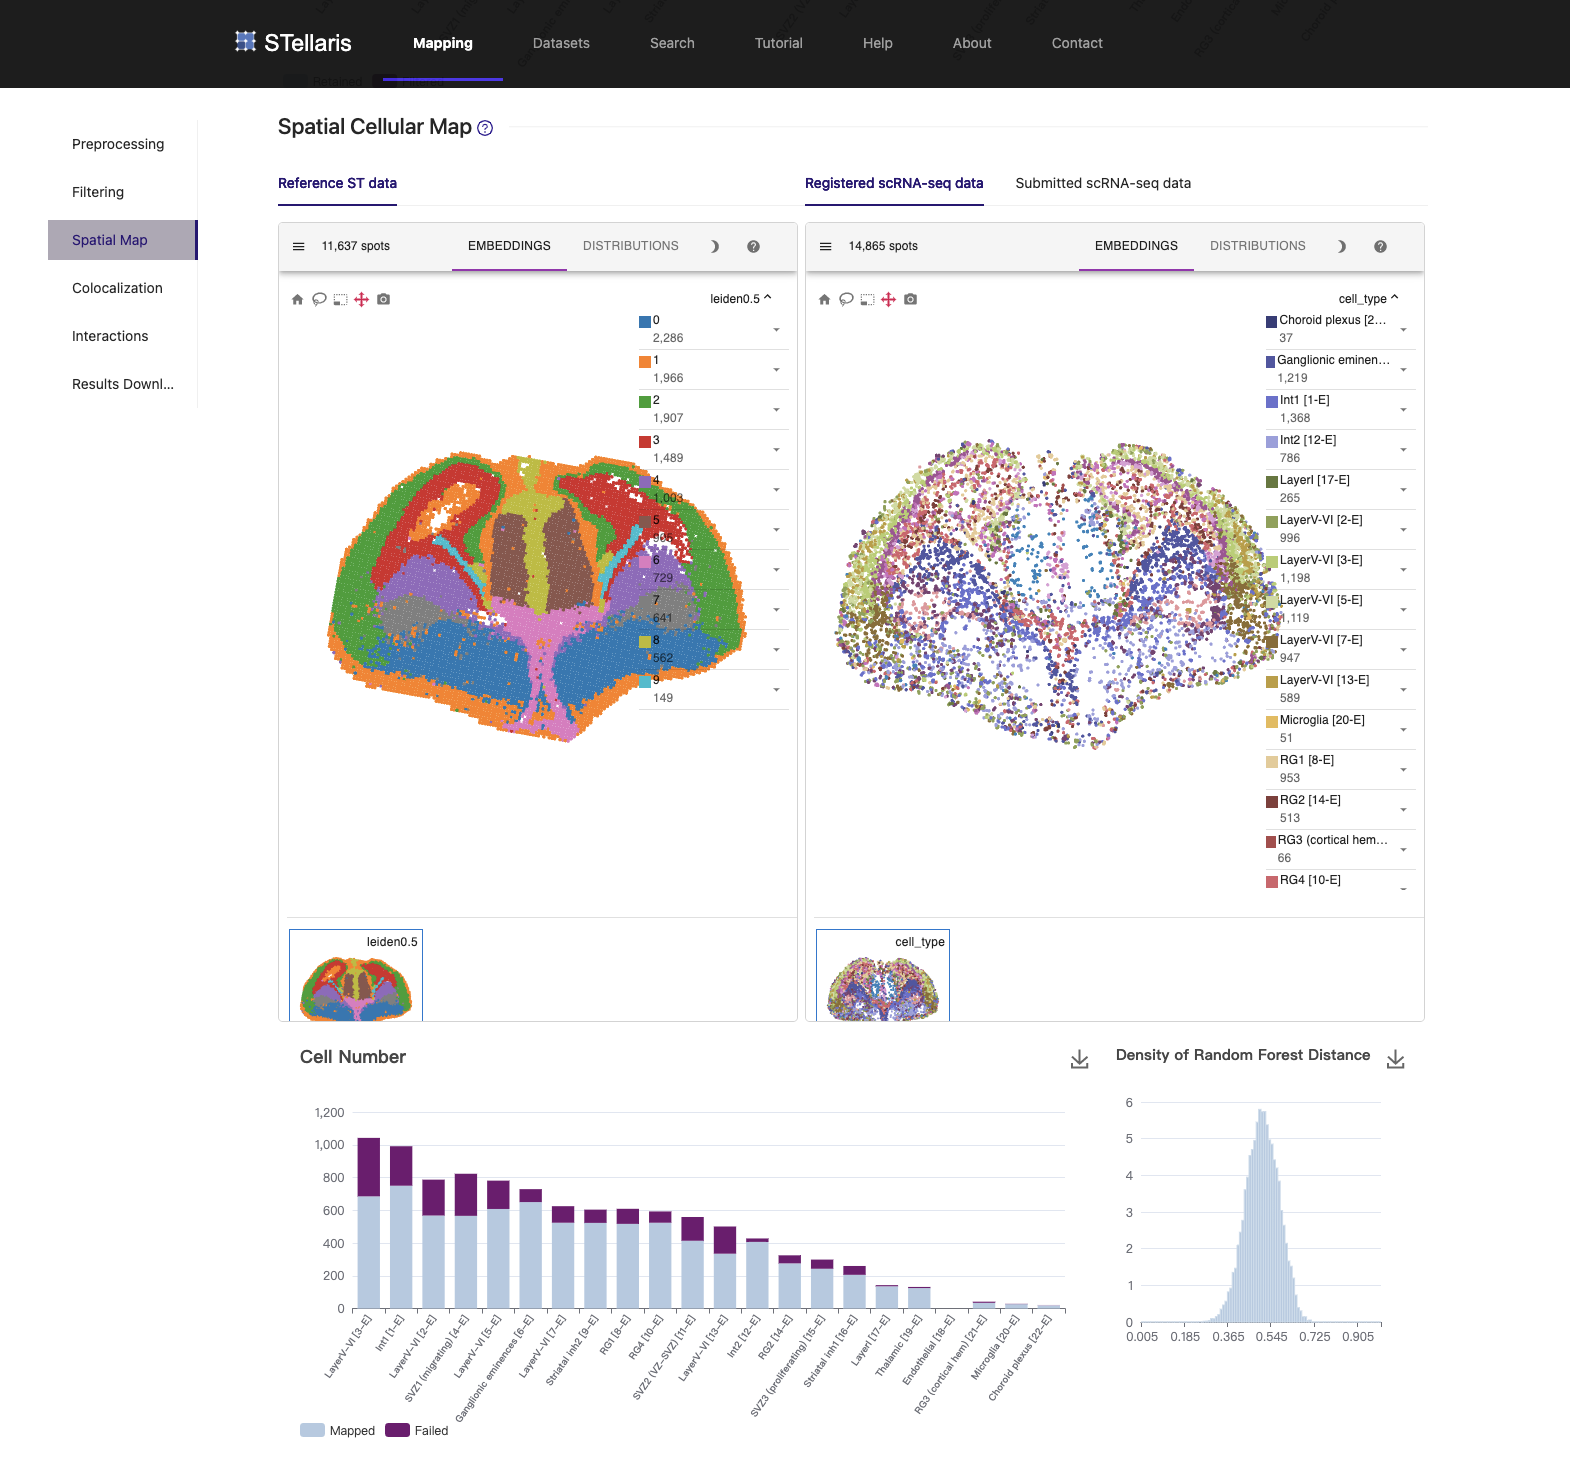
For example, radial glial cells in the cerebral cortex line the ventricles. Ganglionic eminence cells, the progenitor cells of the ventral telencephalon, are located precisely in the ventral part of the brain. Thalamic cells are also positioned in the right place, although they are rarely captured in the scRNA-seq data.


In addition to precise patterning of diverse cell types, the expression profiles of their marker genes, such as Hes5, Dlx2, and Syt13, also successfully recapitulate those observed in the initial ST section.
4. Cell type colocalization
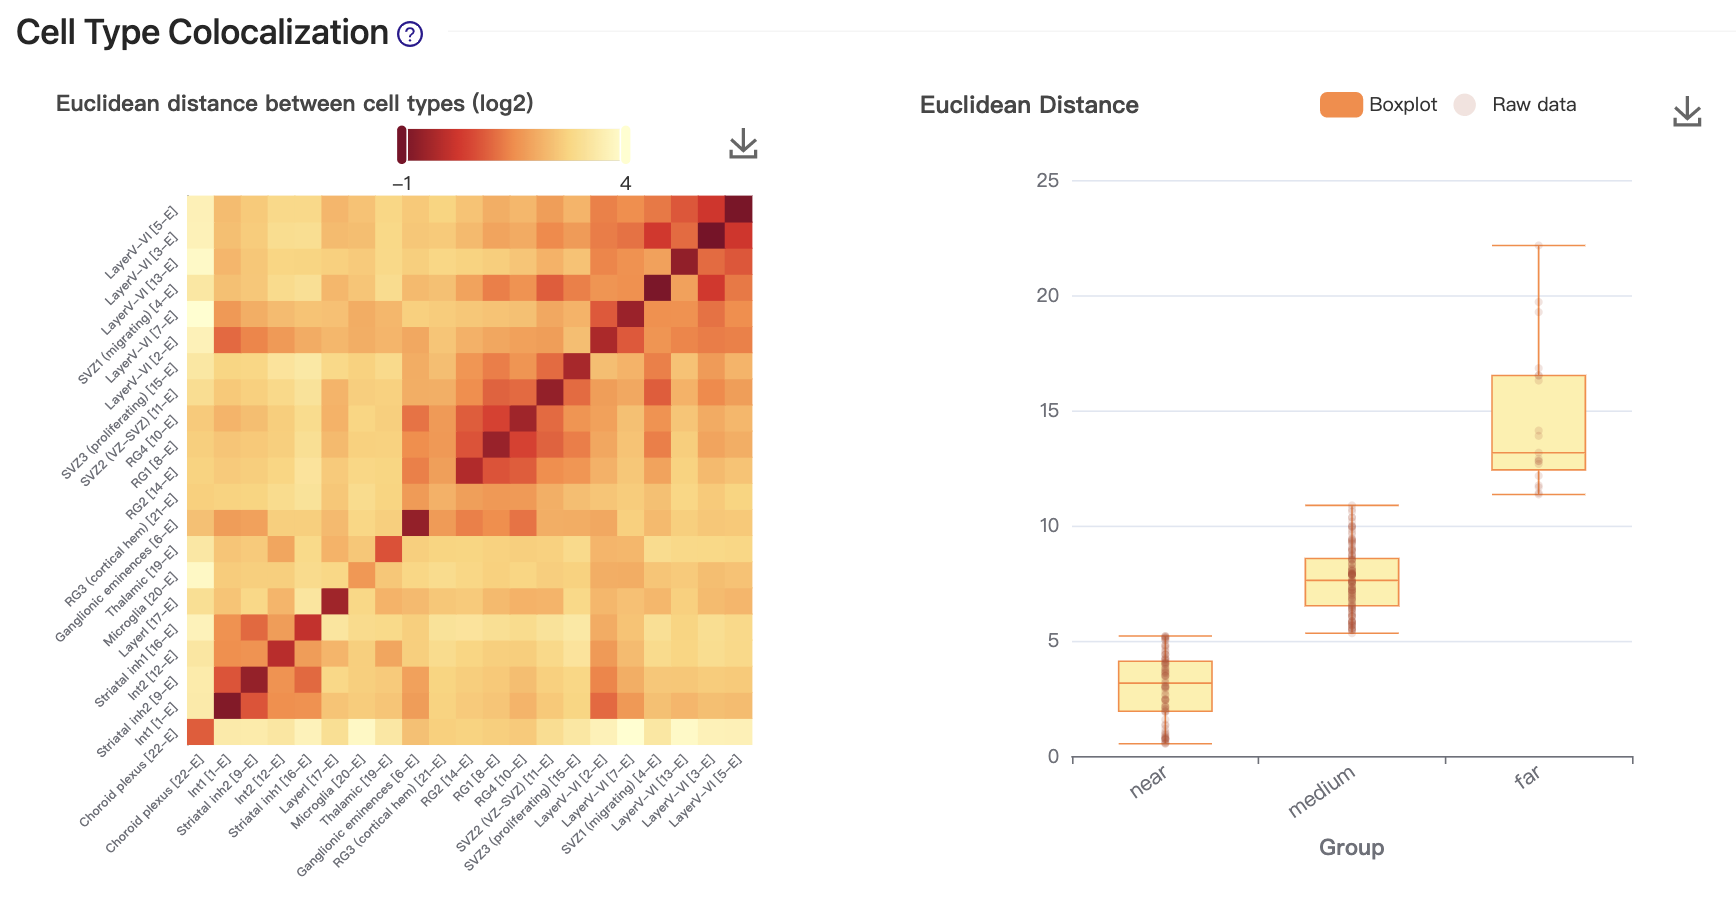
After obtaining the spatial cellular map where single cells are mapped to spatial coordinates, we can assess the spatial proximity of cell types. This is visualized through a cell-cell contact map on the left, where the closeness of a pair of cell types is measured by Euclidean distance. The contact map has been clustered using hierarchical clustering. In this case, the colocalized cell type clusters reveal the anatomical structure of the developing mouse brain.
We then performed k-means clustering (k=3) on the spatial distances of all cell type pairs, and categorized them into three distance groups: "near," "medium," and "far," as shown on the right.
5. Cell-cell ligand-receptor interactions
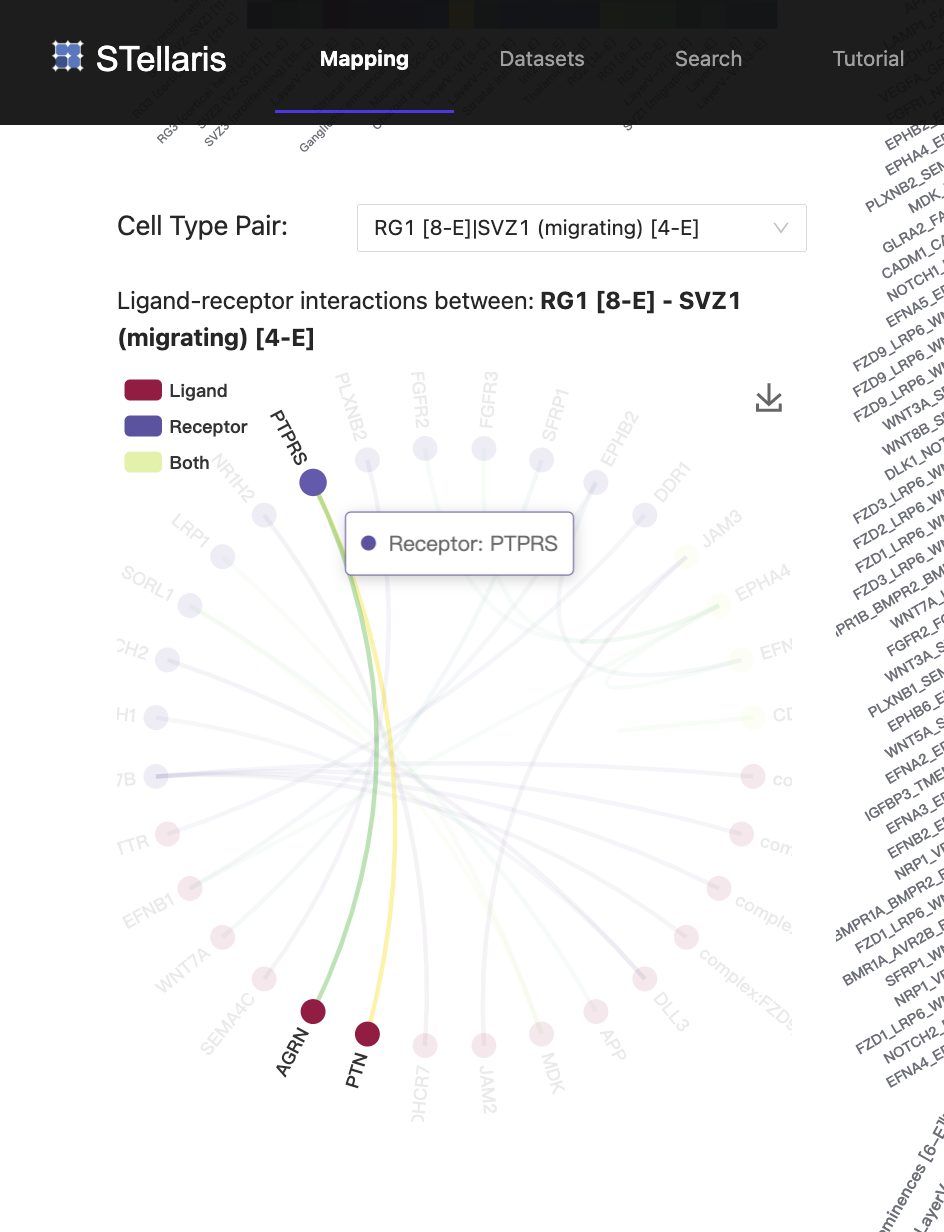
Leveraging the spatial cellular map, STellaris then identifies LRIs for each cell type pair within pre-defined distance groups. The heatmap in the upper left visualizes the number of LRIs detected between each pair of cell types. To view LRIs associated with a specific cell type, you can select it from the drop-down box and view the associated LRIs in a dot plot on the right. STellaris also provides a chord graph on the lower left to present LRIs between two cell types, where the dot colors distinguish gene types, and line colors indicate the expression level of interactions. Please note that the former cell type represents the sender cells, while the latter cell type represents the receiver cells.
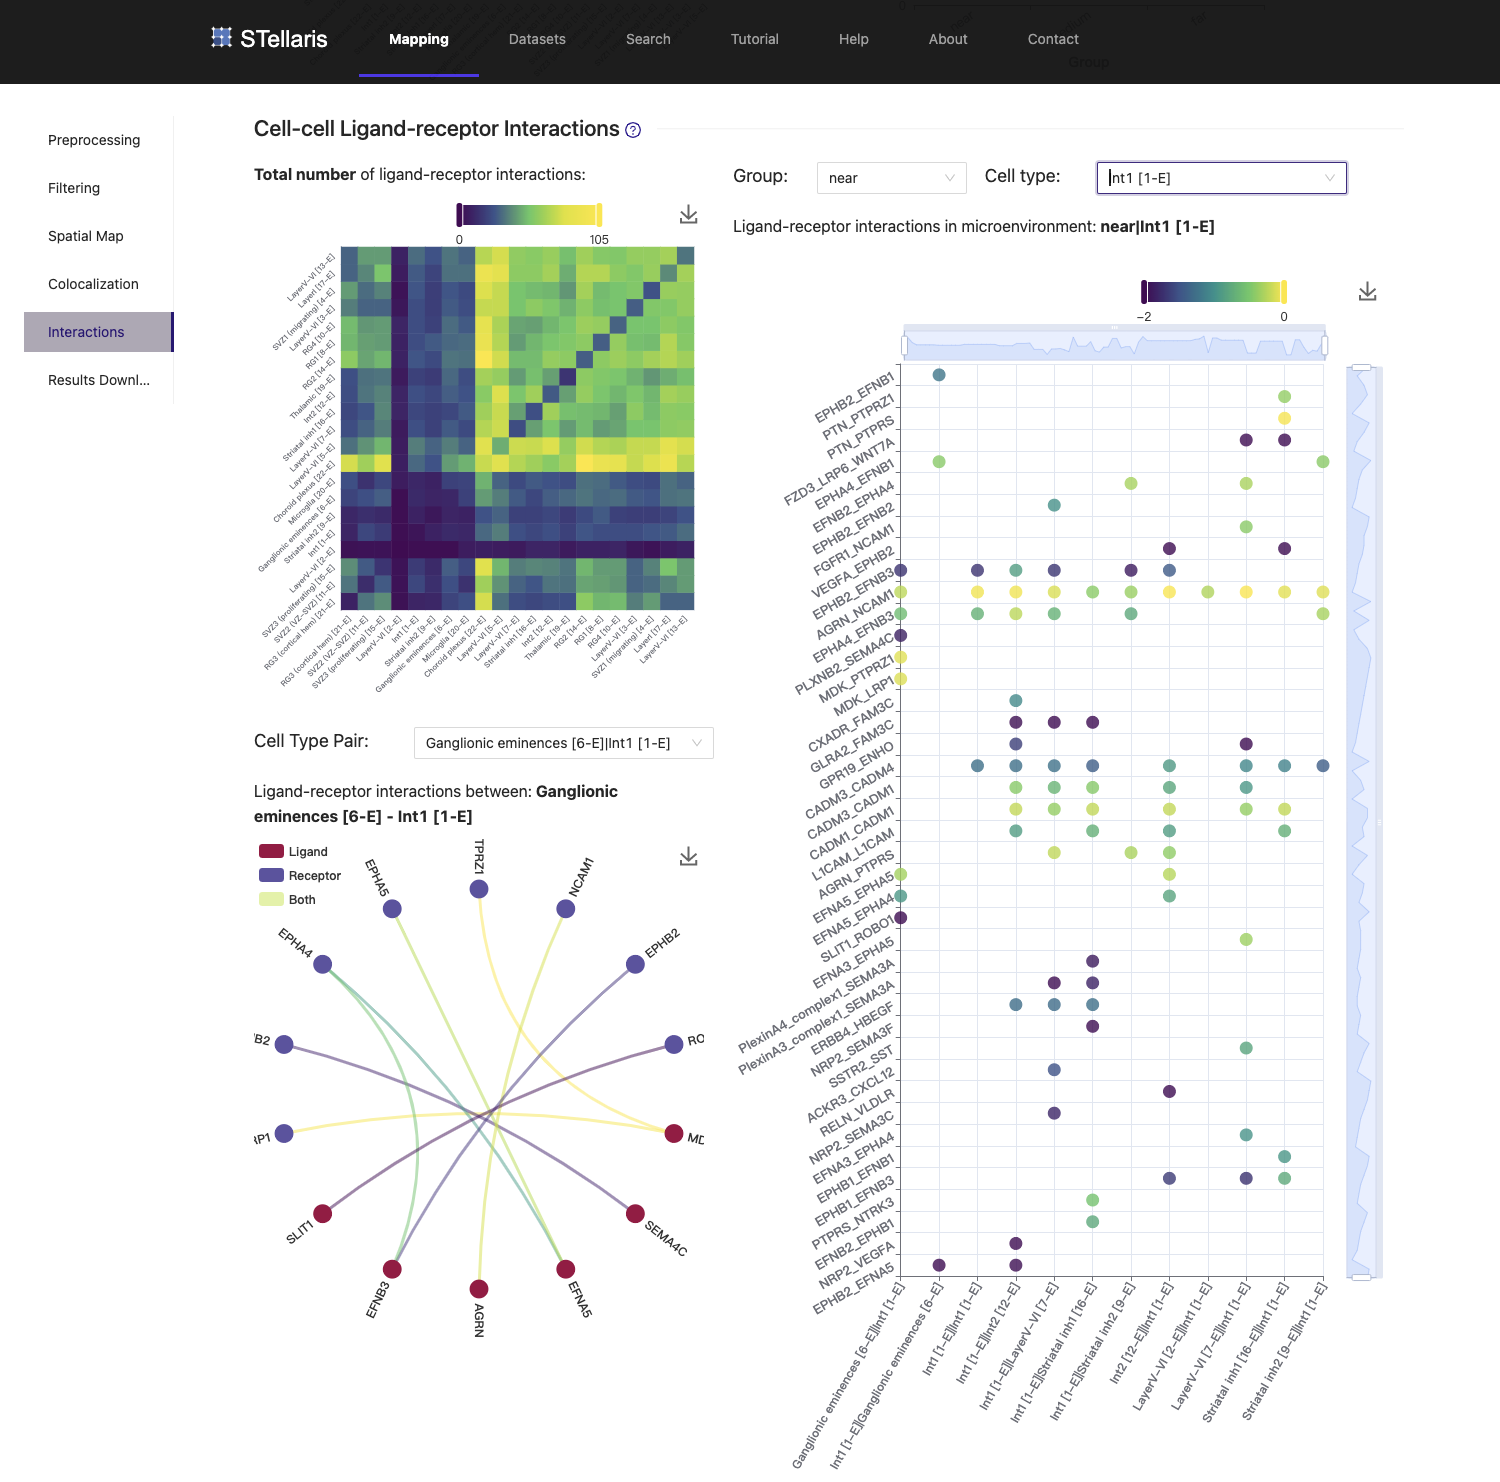
In this example of mouse corticogenesis during the progenitor-driven phase, we investigated the migration process of neuroprogenitors, which is crucial for the expansion of the cerebral cortex. After the onset of neurogenesis, in the ventricular zone (VZ), apical progenitors mainly composed of radial glias (RGs), generate basal progenitors, the secondary class of neuroprogenitors. The newborn basal progenitors then migrate to the subventricular zone (SVZ), where they produce most of cortical neurons. In the scRNA-seq data we are using here, RG1 [8-E] represents the major cell type of RGs that lines the VZ, and SVZ1 (migrating) [14-E] represents the major basal progenitors located in SVZ, which were generated and migrated from VZ. We observed that these two cell types are in close proximity to each other, as they were determined to be in the "near" group. We found that Ptn-Ptprs, the top-ranked LRI between RG1 (sender) and SVZ1 (receiver), is significantly expressed and may be associated with the migration event. These results reinforce previous findings suggesting that PTN acts as a ligand that can bind with CSPGs at the neuron surface, thereby leading to the release of PTPRS, which is required for the radial migration of neurons and lamination of the developing cerebral cortex.
