Questions and Answers
Q: Why can't I upload files or run an example but with an error message: "Run example unsuccessfully. Refresh the page and try again."?
We use the Google-based reCAPTCHA v3 human-machine verification system to detect whether the user uploading the job is a real human rather than an automated program. If there is an anomaly in the network environment you are using, such as using a VPN, proxy server, etc., it may affect the judgment of reCAPTCHA v3. Please turn off the VPN and proxy server, refresh the page, and upload the job again. If the error still exists, please contact the developers.
Q: What quality controls have been developed to evaluate the spatial mapping results in the web server?
We searched for ST-related articles using keywords of "spatial transcriptomics," "spatial transcriptomic," and "spatial omics" on PubMed, and included ST datasets that contain both gene expression matrices and spatial coordinate information. To ensure the high quality of the database, the ST datasets with low spot resolution (< 500 spots/cells) and low coverage (< 10,000 detected genes) were discarded. Finally, we collected 100 public ST datasets from humans and mice, with some of these datasets accompanied by imaging data of histological staining.
Q: What misleading results may occur when the user-uploaded scRNA-seq data does not match well with the existing ST datasets deposited in the database?
Mismapping occurs when the user-uploaded scRNA-seq data does not match well with the existing ST data in the current database.
To address this issue and prevent misleading results, we have implemented a systematic evaluation framework. First, we adopted a screening strategy (section blast) to select the properly matched ST sections that match the user-uploaded scRNA-seq as much as possible. In addition, before spatial mapping, we introduced a filtering method (coembedding filtering) to exclude single cells that are not well mixed with ST spots, avoiding potential mismatches that may lead to misleading results. Finally, after spatial mapping, we provided a metric (RF distance) to further evaluate the reliability of the final mapping results. This evaluation system enables us to quantify and evaluate the conformity between the scRNA-seq data and the ST data and assess the reliability of mapping results.
Based on our practices, our quality control steps perform well to avoid misleading annotations, when analyzing the scRNA-seq data with unmatched tissue types with the ST dataset.
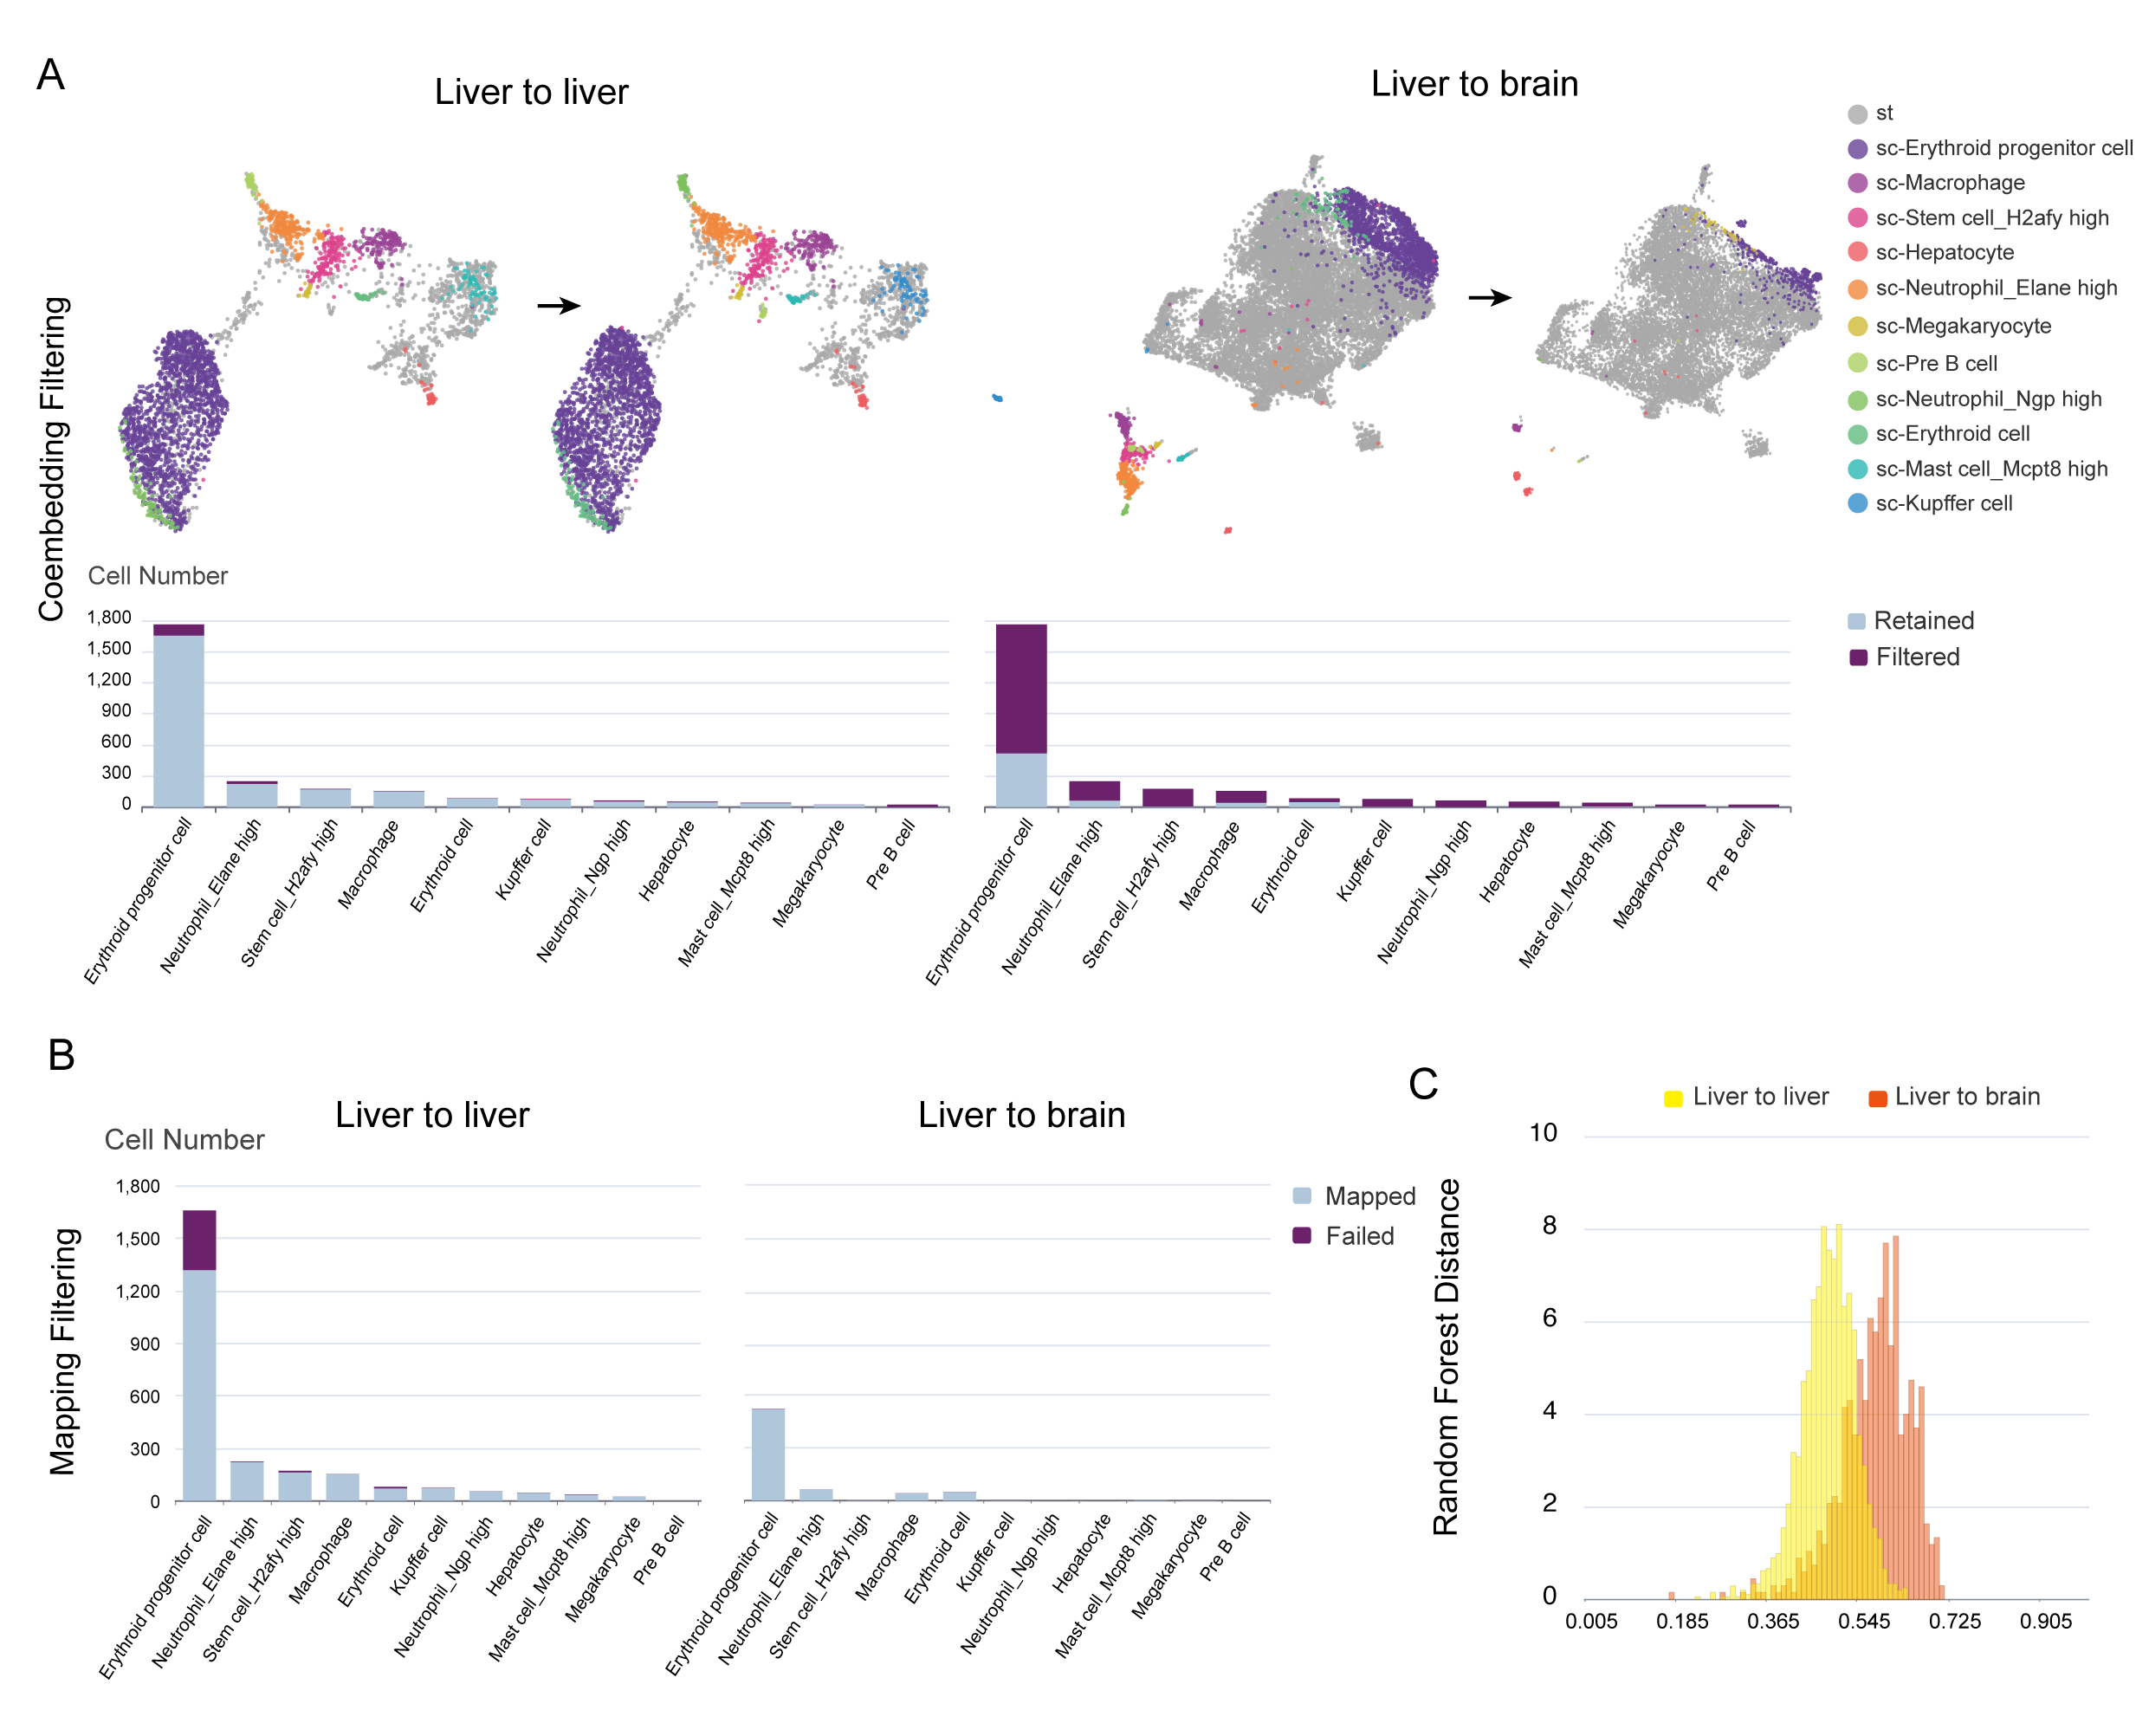
As an example, we mapped the mouse liver scRNA-seq data to two ST data from the mouse liver and brain (liver-to-liver and liver-to-brain), respectively. During the coembedding filtering step, we observed that more cells were excluded in the brain compared to the liver due to not being well mixed with ST spots, which resulted in a lower proportion of cells mapped to the brain ST section than the liver ST section (25.2% vs 79.7%) (Figure A and B). To further assess the reliability of the two mapping results, we found that the RF distance is significantly smaller in the liver-to-liver mapping compared to the liver-to-brain mapping, indicating a more reliable mapping in the liver (Figure C).

In conclusion, we recommend users to select the top-ranked ST sections with matched tissue types or developmental stages for spatial mapping, and the following quality control steps could further help users to prevent misinterpretation of the results from unmatched biological states.
Q: What kind of differences may occur when mapping the same single-cell data to ST datasets generated with different techniques?
As spatial transcriptomics techniques are varied in spot resolution and sequencing depth, mapping the same single-cell data to ST datasets generated with different techniques may result in different annotations.
To further explore this issue, we mapped the single-cell data from the adult mouse brain used in case study 3 to three ST datasets from the top three techniques reported in the section blast step, including:
- Analysis 1: 10x Visium (https://spatial.rhesusbase.com/mapping/resultPage/5722a340-de93-11ed-adc4-89347291db6a);
- Analysis 2: Space-TREX (https://spatial.rhesusbase.com/mapping/resultPage/213f4b20-de66-11ed-aa68-738869f8e887)
- Analysis 3: ST (https://spatial.rhesusbase.com/mapping/resultPage/679f4360-de64-11ed-a102-d3dd38d83307)
We then summarized the mapping results:

Overall, based on the RF distance metric and the number of failed cells, the mapping results of Analysis 1 and Analysis 2 are comparable, which are better than that of Analysis 3. The unsatisfactory results of Analysis 3 could be attributed to the inconsistency of developmental stage between the ST section (P14) and the scRNA-seq data (adult). Regarding Analysis 1 and Analysis 2, the higher sequencing depth of Analysis 2 may explain the lower number of filtered cells compared to Analysis 1 during the coembedding filtering step (1,255 vs 1,930), as high transcriptomic coverage can achieve better integration of scRNA-seq with ST data. Meanwhile, the higher spot resolution of Analysis 1 may account for the lower number of unmapped cells compared to Analysis 2 during the spatial mapping step (782 vs 1,325), as high cell purities could facilitate precise assignment of the locations to single cells.
Taken together, while different techniques may introduce some differences in the mapping results, it is not as significant as biological variation. Furthermore, our systematic evaluation procedures could effectively assess the differences caused by inherent factors of different techniques, such as the spot resolution and the sequencing depth. Notably, the current comparison is based on a limited number of datasets, and a systematic evaluation of the effects of different techniques requires further investigation.
Q: What's the limitation and generalizability of STellaris when applied to dissect the spatial organization?
There are some limitations of STellaris when applied to tissues with extreme spatial organizations:
- for extremely dense tissues, the accuracy of spatial mapping based on transcriptomic similarity may decrease due to relative low cell purities in ST data;
- for tissues with excessively low cell density, the resulting spatial mapping may be sparse;
- for poorly organized tissues, our web server may underestimate the spatial complexity in the mapping results.